A rounding bottom pattern — also called a saucer bottom — is a long, gradual bullish reversal pattern that forms a smooth, “U”-shaped curve as selling pressure slowly gives way to buying pressure, typically over weeks to months. Unlike sharper reversal patterns, it signals a slow shift in market sentiment rather than a sudden capitulation.
If you have spent any time studying continuation patterns like the ascending triangle pattern, you already know that not every setup breaks in a single burst. The rounding bottom takes that idea further: it is one of the slowest, most patience-testing reversal patterns in technical analysis. If you’re new to chart patterns, it’s worth reading forex trading basics first, since this article builds directly on core price-action concepts.
The rounding bottom is closely related to — but distinct from — the cup and handle pattern, a relationship we’ll unpack in detail below, because the two are visually near-identical for most of their formation and confusing them is one of the most common mistakes traders make with this pattern.
What Is a Rounding Bottom Pattern?
Direct answer: A rounding bottom is a bullish reversal chart pattern that forms a smooth, symmetrical “U” or bowl shape at the end of a downtrend, as selling pressure gradually exhausts and buying pressure slowly builds until price breaks out above the level where the decline began.
Visually, a rounding bottom looks nothing like the sharp, angular reversals traders are often taught to spot first. There’s no dramatic spike, no violent whipsaw at the low. Instead, price traces a smooth, gradual curve — round on both sides, like the base of a saucer or bowl sitting on a table. That’s where the “saucer bottom” name comes from, and it’s used interchangeably with “rounding bottom” throughout technical-analysis literature; both terms describe the exact same formation.
Compare this to a V-shaped reversal, where price collapses and then snaps back almost as fast as it fell. A rounding bottom is the opposite temperament entirely. It signals that the shift from sellers to buyers is happening gradually, distributed across many candles and often many weeks, rather than in one decisive event. That gradualness is the defining characteristic of the pattern, and it’s also the reason this pattern behaves so differently from the sharper reversal setups on this site, like the head and shoulders pattern or the double top and double bottom pattern.
What the pattern signals, structurally, is this: a prolonged downtrend loses momentum not through a single reversal event but through a slow erosion of selling pressure. Each new low is shallower than the last, sellers become progressively less committed, and buyers begin stepping in earlier on each successive dip. Eventually the balance tips, and the curve turns upward with the same gradual character it went down with.
How Does a Rounding Bottom Form?
The formation of a rounding bottom happens in three broad phases, and understanding the mechanics of each is what separates a trader who can identify a genuine rounding bottom from one who mistakes ordinary sideways chop for the real thing.
Phase one — the decline decelerates. Price is already in a downtrend, but instead of continuing to fall at a consistent rate, the rate of decline itself starts slowing. Each leg down covers less distance than the one before it. This is the first visual clue that the character of the trend is changing, even though price is still technically making lower lows.
Phase two — the curve flattens near the low. This is the widest, flattest section of the “U,” and it’s also the most deceptive part of the pattern. Price action here can look like directionless chop — a series of small pushes up and down with no clear trend — and it’s genuinely difficult, in real time, to distinguish this phase of a rounding bottom from an ordinary consolidation range that could break in either direction. The only way to build confidence that this is a rounding bottom in progress rather than a random range is to watch how the highs and lows behave over an extended period: in a true rounding bottom, the lows are very gradually rising and the overall structure is bowing upward, even if slowly.
Phase three — the curve accelerates upward. As the pattern completes, the rate of ascent starts to mirror the deceleration seen in phase one, but in reverse — each leg up covers more ground than the last, and the curve steepens noticeably as price approaches the resistance level near the top of the “U.” This is where the pattern moves from theoretical to tradeable, culminating in a breakout above the resistance level that marks where the original decline began.
Volume behavior typically mirrors the price curve and is one of the more reliable ways to build confidence in the pattern as it develops:
- Higher volume on the initial decline — selling pressure is still active and visible.
- Lowest volume near the middle of the curve — this is the point of maximum indecision, where trading interest genuinely dries up as sellers are largely exhausted and buyers haven’t yet committed in size.
- Rising volume again as price climbs out the other side — a sign that buying interest is returning.
- A pronounced volume expansion on the eventual breakout above the pattern’s starting resistance level — this is the single most important volume signal in the entire pattern, because it’s the difference between a genuine breakout and a low-conviction move that’s likely to fail.
A rounding bottom with a textbook volume signature — high, then low, then high again — is a meaningfully more reliable read than one where volume stays flat throughout, which is more likely to indicate ordinary range-bound trading being misread as a pattern that isn’t really there.
How Wide and How Deep Should the Curve Be?
There’s no fixed rule for how wide (in time) or how deep (in price) a genuine rounding bottom needs to be, and traders who look for one exact ratio are usually applying more precision than the pattern actually supports. That said, a few general observations hold up reasonably well across most textbook examples:
- Wider curves tend to be more reliable than narrow ones. A rounding bottom that takes many weeks to form, with a genuinely gradual curve throughout, is generally considered a stronger signal than one that compresses the same “U” shape into a much shorter window, because the longer formation gives more time for the underlying shift in sentiment to actually play out rather than being a temporary pause.
- Symmetry matters more than exact depth. The two sides of the curve don’t need to be identical, but a rounding bottom where the right side (the recovery) takes a wildly different amount of time than the left side (the decline) is more likely to be something else — a different pattern entirely, or no coherent pattern at all — rather than a genuine rounding bottom that simply broke the mold.
- A visibly flat “floor” strengthens the read. Patterns with an extended, relatively flat section at the base of the curve (phase two above) tend to be easier to identify with confidence than those that curve through the low very quickly, because the flat floor gives more opportunity to observe the volume and price behavior that distinguishes a genuine rounding bottom from noise.
None of these are strict qualification rules — they’re observations that can help a trader build more or less confidence in a pattern that’s still forming, not a checklist that mechanically confirms or disqualifies a chart.
Is the Rounding Bottom Bullish or Bearish?
Direct answer: The rounding bottom is a bullish reversal pattern by definition. It typically appears at the end of a prolonged downtrend and signals that sentiment is shifting from selling to buying — but the long time it takes to form is itself a risk factor, discussed in the risk section below.
This is one of the more clear-cut directional calls in chart-pattern analysis. Unlike the neutral symmetrical triangle pattern, which carries no inherent directional bias and can break either way, the rounding bottom is defined by its bullish resolution. If a “U”-shaped curve breaks downward instead of upward, it isn’t a failed rounding bottom in the traditional sense — the pattern’s definition assumes an eventual upside breakout, and a downside break generally means the setup never completed as a genuine rounding bottom in the first place, or that broader market conditions overwhelmed it.
That clarity, though, comes with an important caveat that deserves equal weight: the pattern’s greatest strength — its long, gradual, low-drama formation — is also its greatest practical weakness. A pattern that takes weeks or months to complete asks a lot of a trader’s patience and capital before it ever pays off, and that time cost is a genuine risk consideration, not an afterthought. We treat this properly in the risk section below rather than glossing over it here.
How to Trade a Rounding Bottom Pattern
Because this pattern forms slowly, patience and confirmation matter more here than with faster-forming patterns like flags or triangles. Chasing an early move inside the curve — before the pattern has actually completed — is one of the most common and costly mistakes traders make with this setup.
Entry: The standard entry point is a breakout above the resistance level formed at the start of the curve — in other words, the price level at which the original decline began. This level acts as the pattern’s “neckline” equivalent: until price reclaims it, the rounding bottom is still forming, not confirmed.
Confirmation: A breakout on its own is not enough. Volume expansion on the breakout candle (or candles) is the primary confirmation signal, consistent with the volume behavior described above. Some traders also wait for a retest of the broken resistance level — now expected to act as support — before treating the breakout as validated. This adds time but reduces the risk of acting on a breakout that quickly fails.
Stop-loss placement: Two common approaches:
- A tighter stop below the most recent higher low within the curve, closer to the entry price but more easily triggered by normal volatility.
- A wider stop below the pattern’s lowest point (the base of the curve), which gives the trade more room but risks a larger loss if wrong.
The choice between the two is a function of position sizing and risk tolerance, not a universal rule — neither placement is “correct” in isolation.
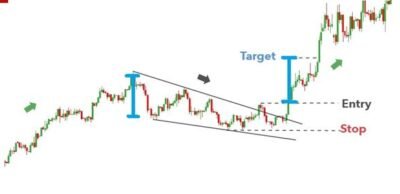
Target-setting: The most widely used method is the measured-move projection: measure the depth of the curve (the vertical distance from its lowest point to the breakout resistance level), then project that same distance upward from the breakout point. This gives a technical price target, not a guarantee — actual price behavior after the breakout depends on broader market conditions, and the projected target should be treated as one input among several, not a promise of where price will go.
As with every pattern on this site, none of this should be read as a recommendation to enter a specific trade. It’s a description of how this pattern is commonly analyzed and traded, not a signal that any particular outcome is likely for any particular chart.
A Simple Walkthrough of the Trade Logic
It can help to walk through the logic in plain terms, without attaching it to any specific real-world chart or instrument. Imagine a currency pair that has been in a steady downtrend for some time. Over the following weeks, the rate of decline visibly slows — each new low is only marginally lower than the one before, rather than a sharp continuation of the prior slide. Price then spends an extended stretch moving sideways in a shallow, choppy range near that low, with volume noticeably thinner than it was during the initial decline. Gradually, the lows in that range start ticking upward, almost imperceptibly at first, and the whole structure begins to visibly bow.
As price approaches the level where the original decline began, the pace of the advance picks up — larger up-moves, more conviction, and volume starting to build again. When price finally pushes through that original resistance level on a clear increase in volume, the rounding bottom is considered confirmed. A trader following the logic outlined above would look to enter around that breakout, place a stop beneath either the most recent higher low or the base of the curve depending on risk tolerance, and use the depth of the curve to estimate a measured-move target — while treating that target as a guide, not a guarantee, and continuing to manage the position based on how price actually behaves afterward rather than the original projection alone.
This is a description of pattern mechanics, not a specific trade recommendation, and it deliberately avoids attaching numbers, currency pairs, or timeframes that could be mistaken for real historical data.
What Is the Difference Between a Rounding Bottom and a Cup and Handle Pattern?
This is the single most important distinction to understand about the rounding bottom, because the two patterns are visually near-identical for most of their formation. In fact, the cup and handle pattern is best understood as a rounding bottom with one additional stage tacked onto the end.
The core distinction is this: a cup and handle pattern includes a second, smaller consolidation dip — the “handle” — that forms after the rounded “cup” completes and before the eventual breakout. That handle is typically a shallow pullback or brief sideways drift lasting days to a couple of weeks, and it acts as a final shakeout of weak buyers before the real breakout occurs.
This pattern, by contrast, has no handle stage at all. It breaks out directly from the top of the curve, with no secondary consolidation dip in between. If you’re watching a “U”-shaped pattern complete and price pulls back briefly before finally breaking out, you’re most likely watching a cup and handle, not a plain saucer bottom. If price breaks out cleanly the moment the curve completes, with no secondary dip first, that’s the hallmark of the genuine article.
Because the two patterns share almost their entire structure up to that point, it’s worth reading the full cup and handle pattern breakdown alongside this one if you want to reliably tell them apart in real time, rather than only after the fact.
What Is the Difference Between a Rounding Bottom and a Double Bottom Pattern?
The second comparison worth making carefully is against the double top and double bottom pattern, because both are bullish reversal patterns that traders commonly confuse when viewing a chart at a low zoom level or on a shorter timeframe.
The core distinction comes down to the shape of the low itself. A double bottom pattern has two distinct, sharp troughs separated by a clear pullback in between — price falls to a low, bounces meaningfully, then falls again to test a similar low a second time before finally breaking out. The two troughs are countable and visually separate.
This pattern, in contrast, is a single, smooth, gradual curve with no distinct secondary trough at all. There’s one low, reached gradually and left gradually, rather than two separate tests of a support level. If you can point to two clearly separate lows on the chart with a visible bounce between them, you’re looking at a double bottom. If the entire base looks like one continuous bowl with no interruption, that’s the saucer shape this article is about.
This distinction matters practically because the two are traded somewhat differently — a double bottom’s second trough can offer an earlier, more defined risk point than anything available mid-curve here, where the base offers no comparable secondary reference point until the breakout itself.
Risks and Limitations of Trading the Rounding Bottom
No chart pattern — including this one — should be treated as a reliable predictor of future price movement on its own. The rounding bottom carries several risks that are specific to its long, gradual character and deserve genuine weight, not a token disclaimer.
Long formation time means real opportunity cost. Because this pattern can take weeks to months to complete, capital and attention committed to watching for it come with a real cost: that same capital isn’t available for other setups in the meantime. A trader who identifies a possible rounding bottom early has no reliable way to know in advance whether it will take three weeks or three months to resolve, and that uncertainty is a genuine planning problem, not a minor inconvenience.
Mistaking ordinary consolidation for a genuine pattern. The flat middle phase of the curve (phase two above) can look identical, in real time, to a directionless trading range that has no bullish resolution coming at all. There is no reliable way to confirm the curve is genuinely in progress until it has clearly begun bowing upward — by which point a meaningful part of the move may already have happened. Treating an early, ambiguous curve as a confirmed setup before the structure is actually established is one of the most common analytical errors traders make here.
False breakouts. Like any setup that relies on a breakout above a resistance level, this pattern is vulnerable to false breakouts — price pushes above the resistance level, triggers entries, and then reverses back into the range. This is precisely why volume confirmation on the breakout matters as much as it does: a breakout on weak volume is meaningfully more likely to fail than one accompanied by a genuine expansion in participation.
Need for volume confirmation, specifically. Because the internal volume signature (high–low–high) is part of what makes a curve a genuine reversal setup rather than random noise, skipping volume analysis altogether removes one of the few objective checks available here.
Sensitivity to broader market conditions. Because the formation takes so long to complete, it’s also more exposed than faster patterns to shifts in the broader market environment that have nothing to do with the specific instrument being charted — a change in overall risk sentiment, a shift in interest-rate expectations, or a broader trend reversal across correlated markets can all interrupt or invalidate the setup mid-formation, in a way that’s much less likely to happen to a pattern that resolves in days rather than months.
One input among many. As with every pattern discussed on this site, the rounding bottom should be treated as one input into a broader trading and risk-management process — never a standalone signal, and never a basis for position sizing or leverage decisions made in isolation. Forex trading carries substantial risk, and past chart behavior, including historical pattern performance, does not guarantee future results.
FAQs
Is a rounding bottom the same as a saucer bottom?
Yes. “Rounding bottom” and “saucer bottom” are two names for the exact same bullish reversal pattern — a smooth, gradual “U”-shaped curve. The terms are used interchangeably in technical-analysis literature.
How long does a rounding bottom pattern take to form?
There’s no fixed duration — genuine rounding bottoms typically develop over weeks to months, considerably longer than sharper reversal patterns, which is part of what defines the pattern.
What is the difference between a rounding bottom and a triple bottom pattern?
A triple top and triple bottom pattern has three distinct, separate troughs at a similar price level. A rounding bottom has one continuous curve with no separate troughs at all.
What timeframe works best for spotting a rounding bottom pattern?
Higher timeframes — daily and weekly charts — are generally better suited to this pattern, since its long, gradual formation is difficult to distinguish from noise on lower timeframes.
Key Takeaways
- A rounding bottom (or saucer bottom) is a bullish reversal pattern that forms a smooth “U”-shaped curve over weeks to months, as selling pressure gradually gives way to buying pressure.
- It differs from sharp reversal patterns like the head and shoulders or double bottom by its slow, gradual character rather than a sudden capitulation.
- Volume typically follows a high–low–high curve, with a pronounced expansion on the eventual breakout — the most important confirmation signal for this pattern.
- The single most important distinction is against the cup and handle pattern: a cup and handle has a second consolidation “handle” after the curve completes; a rounding bottom breaks out directly with no handle stage.
- The pattern’s long formation time is itself a genuine risk factor — patience and volume confirmation matter more here than with faster-forming setups.
Summary
A rounding bottom (or saucer bottom) is a bullish reversal pattern defined by its slow, gradual “U”-shaped curve, forming as selling pressure exhausts and buying pressure gradually builds over weeks to months — a fundamentally different temperament from the sharper reversal patterns covered elsewhere on this site. The core trade logic is straightforward but demands patience: confirm the curve has genuinely completed, wait for a breakout above the pattern’s starting resistance level, and look for volume expansion before treating the move as valid.
The single most useful distinction to carry forward is against the closely related cup and handle pattern — remember, the presence or absence of a secondary “handle” dip after the curve completes is what separates the two. If you’re still building your foundation in chart patterns, start with forex trading basics before working through the rest of this site’s pattern library.