The double top and double bottom pattern are two of the most widely recognized reversal patterns in technical analysis, and they are best understood together because they are mirror images of one another. A double top forms at the end of an uptrend and signals a possible shift from bullish to bearish price action, while a double bottom forms at the end of a downtrend and signals a possible shift from bearish to bullish price action. Both patterns are built around the same core idea: price tests a key level twice, fails to break through it a second time, and reverses.
If you’re new to chart patterns and forex trading basics, it’s worth understanding candlesticks, support and resistance, and trend direction before working through this pattern in depth. This article covers what a double top and a double bottom actually look like, how each one forms, how traders commonly approach entries and exits around them, and where the pattern can go wrong.
What Is a Double Top Pattern?
A double top pattern is a bearish reversal pattern that forms after an extended uptrend, when price rallies to a resistance level, pulls back, rallies again to roughly the same level, and then fails to break through a second time.
Visually, a double top looks like the letter “M.” Price pushes up to form the first peak, retraces to a moderate pullback low, then pushes back up to form a second peak that reaches approximately the same height as the first — without meaningfully exceeding it. The two peaks don’t need to be identical; small variations in height are normal and traders generally still consider the pattern valid as long as the second peak doesn’t push convincingly higher than the first.
What the pattern signals is straightforward: buyers tried to push price above a resistance level twice and failed both times. That repeated failure is read as exhaustion of buying pressure — the trend that carried price up to that level is losing momentum, and sellers are starting to take control at that price zone. A double top is not automatically bearish the moment two peaks appear, though — it isn’t confirmed until price breaks below the support level between the two peaks (the neckline, covered in the next section).
What Is a Double Bottom Pattern?
A double bottom pattern is the bullish mirror image of a double top. It forms after an extended downtrend, when price falls to a support level, bounces, falls again to roughly the same level, and then fails to break through a second time.
Visually, a double bottom looks like the letter “W.” Price drops to form the first trough, retraces upward to a moderate pullback high, then drops back down to form a second trough at approximately the same depth as the first — without meaningfully breaking below it. As with the double top, the two troughs rarely line up perfectly; a reasonably close second test is typically enough for traders to consider the pattern intact, provided it doesn’t clearly undercut the first low.
The signal here is the inverse of the double top: sellers tried to push price below a support level twice and failed both times. That repeated failure is read as exhaustion of selling pressure — the downtrend that drove price to that level is running out of force, and buyers are starting to defend that price zone. Just like the double top, a double bottom isn’t confirmed by the two troughs alone — confirmation comes when price breaks above the resistance level between the two troughs (again, the neckline).
How Do Double Top and Double Bottom Patterns Form?
Both patterns follow the same structural sequence, just inverted depending on direction. Understanding the mechanics step by step makes it easier to recognize the pattern as it develops on a live chart, rather than only in hindsight.
1. The First Peak or Trough
In a double top, this is the initial rally that reaches a resistance level and stalls. In a double bottom, it’s the initial decline that reaches a support level and stalls. This first extreme sets the reference point the second test will be measured against.
Underneath that stall is a straightforward supply-and-demand story. In a double top, an uptrend has been attracting buyers who keep pushing price higher on the expectation that the move continues — but at some price level, sellers (whether that’s profit-taking from earlier longs, fresh short entries, or both) become aggressive enough to absorb that buying and halt the advance. The reverse applies at the first trough of a double bottom: a downtrend has been rewarding sellers, but at some level, buyers step in with enough size to absorb the selling pressure and stall the decline. Neither event is dramatic on its own — plenty of trends pause and continue — which is exactly why this first extreme is only a reference point, not a signal.
2. The Pullback to the Neckline
After the first peak or trough, price retraces in the opposite direction and finds a temporary support or resistance level of its own. This retracement level is what becomes the neckline — a horizontal (or near-horizontal) line connecting the low between the two peaks in a double top, or the high between the two troughs in a double bottom.
This pullback reflects a genuine, if temporary, shift in control. After a double top’s first peak, the sellers who stalled the rally push price back down, and the pace and depth of that pullback says something about how convinced the market is: a sharp, fast pullback tends to reflect more forceful selling than a shallow, slow drift lower. In a double bottom, the bounce off the first trough reflects buyers temporarily overpowering the sellers who had been driving the downtrend. Either way, the pullback low (or high) that forms here isn’t incidental — it becomes the level the market has to fail to defend for the pattern to eventually confirm.
3. The Second Test
Price then moves back toward the original extreme and tests it a second time. For the pattern to remain valid, this second test needs to fail to meaningfully exceed the first peak (double top) or fail to meaningfully break below the first trough (double bottom). A close second test that respects the prior level is what gives the pattern its “double” structure.
This is the stage where the pattern’s underlying logic actually plays out in real time. The move back toward the prior extreme typically reflects the original trend’s supporters making one more attempt to reassert control — buyers trying to push a double top’s price back above the first peak, or sellers trying to drive a double bottom’s price back below the first trough. When that attempt fails at (or near) the same level that stopped price the first time, it’s read as meaningful: the same group that absorbed the move once has now done so twice, at effectively the same price, which strengthens the case that this is a genuine area of exhausted demand or supply rather than a coincidence. A second test that stalls well short of the first extreme, or that barely grazes it before reversing, is generally read the same way as one that matches it closely — what matters most is the failure to convincingly exceed the prior level, not exact symmetry.
4. The Neckline Break
The pattern is only confirmed when price breaks through the neckline — downward for a double top, upward for a double bottom. Until that break happens, what looks like a double top or double bottom is still just an unconfirmed formation; price could just as easily push through the resistance or support level and continue the original trend instead of reversing.
The neckline break itself represents the point where the pullback-stage participants lose control. In a double top, the buyers who defended the neckline level during the pullback are finally overwhelmed, and price gives way below that support — a sign that sellers have moved from merely capping rallies at the resistance zone to actively driving price lower through what had been a support level. In a double bottom, the sellers who had been defending the neckline as resistance are overwhelmed, and price pushes up through it — sellers stepping back and buyers taking control of the broader move, not just the local test. This is also why the break matters more than the two peaks or troughs alone: it’s the first point in the sequence where the opposing side is shown losing ground on a level it had previously held.
Volume Behavior
A commonly cited — though not universal — volume signature on these patterns is lower volume on the second peak or trough compared to the first. The idea is that reduced participation on the second test reflects fading conviction behind the move. This isn’t a guaranteed feature of every double top or double bottom, and traders shouldn’t treat its absence as automatically invalidating the pattern, but when it is present it’s often read as additional supporting evidence alongside the neckline break itself.
Volume Divergence Across the Two Peaks or Troughs
A related but distinct idea worth separating out is volume divergence — not just lower volume on the second test in isolation, but a broader mismatch between price and volume across the whole two-peak or two-trough sequence. In a double top, the first peak is often accompanied by comparatively strong volume, consistent with a trend that still has genuine participation behind it. The second peak, even when it reaches a similar price, is frequently accompanied by comparatively weak volume — price revisits the level, but with less trading activity supporting the move, which is read as a sign that fewer participants are willing to commit to new highs at that price. The same divergence shows up inverted in a double bottom: heavier volume on the first trough, lighter volume on the second, even though price reaches a similar low. Traders who watch for this treat it as a secondary, supporting signal — it’s a piece of the picture that adds context to the neckline break, not a standalone trigger, and plenty of valid double tops and double bottoms form without a textbook-clean volume divergence at all.
How to Trade Double Top and Double Bottom Patterns
The core trading logic is the same for both patterns, mirrored by direction. As with any chart pattern, none of the following should be read as a guarantee of a particular outcome — it’s a description of common approaches, not a promise of results.
Entry
The typical entry trigger is a break and close beyond the neckline: a close below the neckline for a double top, or a close above the neckline for a double bottom. Waiting for a full candle close beyond the neckline, rather than acting on an intraday wick or a partial break, is a common way traders try to filter out false signals.
Confirmation
Beyond the neckline break itself, traders commonly look for two additional forms of confirmation. First, volume on the breakout candle — a genuine breakout is often (though again, not always) accompanied by an increase in volume relative to the preceding price action. Second, a retest of the neckline: after breaking through, price sometimes returns to test the neckline from the opposite side before continuing in the breakout direction. Not every valid pattern retests, but when a retest does occur and holds, it’s often treated as added confidence in the move.
Stop-Loss Placement
For a double top, a stop-loss is commonly placed above the second peak — if price reclaims that level, the bearish thesis behind the pattern is generally considered invalidated. For a double bottom, a stop-loss is commonly placed below the second trough, on the same logic in reverse. Exact placement varies by trader and by how much room is given for normal price fluctuation.
Target-Setting via the Measured Move
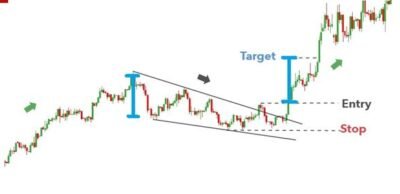
A widely used approach for setting a target is the measured move: take the vertical distance from the peak (or trough) down to (or up from) the neckline, then project that same distance from the point where price breaks the neckline. For a double top, this means measuring from the peak down to the neckline and projecting that distance downward from the breakout point. For a double bottom, it means measuring from the trough up to the neckline and projecting that distance upward from the breakout point. This is a commonly used technique for estimating a potential target, not a formula that guarantees price will reach that level.
A Worked Example: Trading a Double Bottom
The mechanics above are easier to follow with numbers attached. The walk-through below is a hypothetical, illustrative example only — it isn’t a record of an actual trade, and the price levels are chosen purely to make the entry, stop, and target math easy to follow, not to represent a real chart.
Suppose a currency pair has been in a downtrend and falls to 1.0500, where it stalls and bounces — that’s the first trough. It retraces upward to 1.0650, which becomes the neckline, before turning back down. Price falls a second time and finds support again at roughly 1.0510, slightly above the first trough, then starts pushing higher — that’s the second test holding. From there, price rallies and closes a full candle above the 1.0650 neckline, which is the entry trigger.
- Entry: on the close above the 1.0650 neckline, or after a shallow retest of 1.0650 that holds as support before price continues higher.
- Stop-loss: placed below the second trough, for example around 1.0480 — if price falls back through the second trough, the bullish case behind the pattern is considered invalidated.
- Measured-move target: the distance from the first trough (1.0500) to the neckline (1.0650) is 150 pips. Projected upward from the breakout point at 1.0650, that gives a target of approximately 1.0800.
- Risk framing: in this example, the distance from entry (1.0650) to the stop (1.0480) is roughly 170 pips, against a projected move of roughly 150 pips to the measured-move target — a reminder that the measured move is an estimate of potential reward, not a promise, and traders typically weigh it against their own stop distance and position sizing rather than assuming the projected target will be reached.
A double top would follow the identical logic in reverse: entry on a close below the neckline, stop above the second peak, and a measured-move target projected downward by the same vertical distance from peak to neckline.
What Is the Difference Between a Double Top and a Head and Shoulders Pattern?
A double top and a head and shoulders pattern are both bearish reversal patterns that form at the top of an uptrend, and they’re often confused because both involve price testing a resistance zone more than once before reversing. The core structural difference is the number of peaks: a double top is a two-peak pattern with a single intervening pullback, while a head and shoulders pattern is a three-peak pattern with a distinctly higher middle peak (the head) flanked by two lower, roughly matching shoulders. Because it only requires two tests of resistance rather than three, a double top is structurally simpler and often forms over a shorter timeframe than a head and shoulders pattern.
What Is the Difference Between a Double Bottom and a Rectangle Pattern?
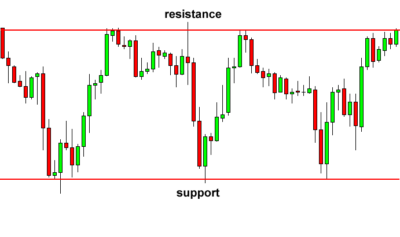
A double bottom and a rectangle pattern can look similar at a glance because both involve price testing a support level more than once, but the underlying structure is different. A rectangle pattern involves repeated tests of both a support boundary and a resistance boundary over an extended sideways range, with price bouncing between the two multiple times before eventually breaking out in either direction. A double bottom, by contrast, is specifically about two tests of a single support level followed by a reversal through the neckline — it isn’t an ongoing consolidation range, and it doesn’t require repeated tests of an upper boundary the way a rectangle does.
Risks and Limitations of Trading Double Top and Double Bottom Patterns
Like any chart pattern, double tops and double bottoms fail, and treating either pattern as a guaranteed reversal signal is a common and costly mistake.
False breakouts and failed necklines. Price can break the neckline and then reverse straight back through it, trapping traders who entered on the initial break. This is one of the more common failure modes for both patterns and is a large part of why many traders wait for a candle close beyond the neckline, or a retest that holds, rather than acting on the first sign of a break.
Misreading normal consolidation as a reversal. Not every instance of price testing a level twice is a double top or double bottom in the making. Markets frequently move sideways or test the same level multiple times as part of ordinary range-bound behavior rather than building toward a genuine reversal. Labeling a pattern too early — before the neckline break actually happens — is a frequent source of false signals.
The need for confirmation. Because the pattern isn’t confirmed until the neckline breaks, acting on the shape of two peaks or two troughs alone, without waiting for that break (and ideally without some volume or retest confirmation), significantly increases the risk of trading a pattern that never actually completes.
Premature labeling before the second peak or trough confirms. A single peak or trough followed by a pullback looks, in the moment, identical to the first half of a double top or double bottom — but it’s also identical to the first half of ordinary trend continuation, a head and shoulders pattern still in progress, or a simple retracement. Traders sometimes label a pattern as a double top or double bottom as soon as price starts pulling back from the first extreme, well before a genuine second test has even occurred. Until price actually returns to test the prior level a second time and fails to exceed it, there’s no way to distinguish a developing double top or double bottom from a trend that’s simply pausing before continuing in its original direction.
False neckline breaks that reverse quickly. A related but distinct failure mode from the false breakout described above is a neckline break that initially looks clean — a full candle closes beyond the neckline, sometimes even on elevated volume — but price reverses back through the neckline within one or two subsequent candles, before a position has time to move meaningfully into profit. This is part of why some traders build in a brief confirmation window (such as waiting to see whether the breakout candle’s level holds for a candle or two) rather than treating a single close beyond the neckline as final proof the pattern has completed, even though doing so means accepting a less favorable entry price in exchange for fewer false signals.
One input among several. A double top or double bottom pattern reflects price structure on a chart; it does not account for fundamental drivers, broader market context, or risk management on its own. As with the other pattern posts on this site, this is best treated as one input in a broader analysis process rather than a standalone trading signal.
FAQs
Is a double top bullish or bearish?
A double top is bearish. It forms at the top of an uptrend and signals a potential reversal from bullish to bearish price action once the neckline breaks.
How long does it take for a double top or double bottom to form?
There’s no fixed timeframe — formation length varies by market and timeframe. Some develop over weeks; others take months, depending on the chart being analyzed.
What is the neckline in a double top pattern?
The neckline is the support level formed by the pullback low between the two peaks. A close below it is generally treated as confirming the pattern.
What is the difference between a double top and a descending triangle pattern?
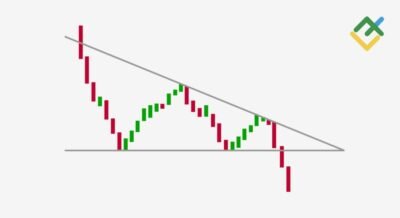
A double top has two roughly equal peaks and a single neckline test, while a descending triangle has a flat support line and a series of lower highs pressing down against it.
What is the difference between a double top and a triple top pattern?
The distinction is simply the peak count. A double top has two roughly equal highs testing the same resistance before the neckline break, while a triple top pattern requires a third test of that same level before it’s confirmed — generally read as a slightly more extended distribution phase than a double top.
Key Takeaways
- A double top is a bearish reversal pattern with two roughly equal peaks (“M” shape) at the top of an uptrend; a double bottom is its bullish mirror image with two roughly equal troughs (“W” shape) at the bottom of a downtrend.
- Both patterns are only confirmed by a neckline break — the shape of the two peaks or troughs alone is not enough to act on.
- Entries are commonly based on a close beyond the neckline, with volume and a neckline retest often used as additional confirmation.
- Stop-losses are typically placed beyond the second peak or trough, with targets estimated using the measured-move technique.
- False breakouts and misreading ordinary consolidation as a reversal are the two biggest practical risks with these patterns.
Summary
The double top and double bottom pattern are two sides of the same reversal concept: price tests a key level twice, fails to break through a second time, and reverses once the neckline gives way. A double top forms at the top of an uptrend and points to a possible bearish shift; a double bottom forms at the bottom of a downtrend and points to a possible bullish shift. In both cases, the pattern isn’t complete until the neckline breaks, and confirmation through volume or a retest adds meaningful weight to the signal. As with every pattern covered on this site, treat this as one part of a broader read on the chart rather than a signal to act on alone. If you’re still building your foundation, start with our forex trading basics guide, or continue exploring related setups like the rectangle chart pattern.