A head and shoulders pattern is a three-peak price formation that signals a potential reversal from an uptrend to a downtrend. It is one of the most recognized reversal signals in technical analysis, built from a left shoulder, a higher head, and a right shoulder connected by a support line called the neckline. This guide covers how the pattern forms, how its bullish mirror image — the inverse head and shoulders — works, and how traders commonly approach entries, stops, and targets around it.
Chart patterns like this one are a core part of technical analysis, and if you’re new to reading price charts altogether, it’s worth starting with our forex trading basics guide before working through pattern-specific mechanics. From here, we’ll break the head and shoulders pattern down step by step: what it looks like, how it forms, what the inverse version means, how it’s typically traded, and — just as important — where it can go wrong.
What Is a Head and Shoulders Pattern?
A head and shoulders pattern is a reversal chart pattern made up of three peaks — a left shoulder, a higher central peak called the head, and a right shoulder that roughly matches the left — connected at the base by a support line known as the neckline.
The pattern typically appears at the top of an uptrend and is read as a signal that buying pressure is fading and a shift toward selling pressure may be underway. Visually, it resembles a rough silhouette of a head and two shoulders sitting on a baseline — hence the name. The three peaks form as price pushes higher, pulls back, pushes to a new (higher) high, pulls back again, then makes a final push that fails to reach the height of the head before falling back through the neckline.
Because the shape is so visually distinct, it’s one of the more widely taught reversal patterns in technical analysis education. That familiarity is a double-edged sword: it makes the pattern easy to spot, but it also means traders sometimes see a head and shoulders shape where the structure doesn’t actually hold up on closer inspection. We’ll come back to that in the risks section below — for now, the important part is understanding the standard, textbook-clean version of the structure.
The head and shoulders pattern is generally classified as a bearish reversal pattern when it appears after a sustained uptrend, since it marks a potential transition from higher highs to a breakdown in structure. Its mirror image, the inverse head and shoulders, plays the same role at the bottom of a downtrend but signals a bullish reversal instead — covered in full further down this article.
How Does a Head and Shoulders Pattern Form?
The head and shoulders pattern forms in a defined sequence over three separate price swings. Understanding the order these pieces form in — not just the final shape — is what actually helps you identify the pattern while it’s still developing, rather than only recognizing it in hindsight.
1. The Left Shoulder
The left shoulder forms first, during an existing uptrend. Price pushes up to a peak, then pulls back to a temporary low. At this stage, the move can look like a completely normal continuation pullback within a healthy uptrend — there’s nothing about the left shoulder in isolation that signals a reversal is coming.
2. The Head
From the low of that first pullback, price pushes higher again, this time exceeding the height of the left shoulder’s peak. This higher peak is the head. After reaching it, price pulls back a second time, typically down toward a similar level as the first pullback low. This is the point where a head and shoulders pattern first becomes visible as a possibility, though it’s still not confirmed.
3. The Right Shoulder
From the head’s pullback low, price attempts to rally a third time but fails to reach the height of the head — instead topping out at a level that roughly matches the height of the left shoulder. This lower peak is the right shoulder. The failure to make a new high here is a meaningful signal: it shows buyers were unable to repeat the strength that produced the head.
4. The Neckline
Connecting the two pullback lows — the one between the left shoulder and the head, and the one between the head and the right shoulder — draws a line known as the neckline. The neckline can be flat or slightly sloped (upward or downward), and it acts as the key support level for the pattern. A confirmed break and close below the neckline is generally considered the point at which the head and shoulders pattern is complete and the reversal signal is active.
Volume Behavior
Volume is commonly cited as a supporting detail in head and shoulders formations: many textbook examples show higher volume on the left shoulder and head, with volume tapering off into the right shoulder, followed by an increase in volume on the neckline breakout. This is a widely observed tendency rather than a strict rule — some valid patterns form without this exact volume signature, so it should be treated as a supporting confirmation factor, not a requirement for the pattern to be considered valid.
What Is the Inverse Head and Shoulders Pattern?
An inverse head and shoulders pattern is the bullish mirror image of the standard pattern — three troughs instead of three peaks, forming at the bottom of a downtrend and signaling a potential reversal from selling pressure to buying pressure.
Where the standard head and shoulders pattern is built from peaks, the inverse version is built from troughs. It appears after a sustained downtrend and follows the exact same structural logic, just flipped vertically. Because “inverse head and shoulders” is searched and studied as its own distinct pattern almost as often as the standard version, it’s worth walking through its formation in the same detail.
How the Inverse Pattern Forms
The left shoulder forms first: price falls to a trough during an existing downtrend, then bounces to a temporary high. From that bounce high, price falls again — this time to a lower trough than the left shoulder — forming the head. Price then bounces a second time, roughly back toward the level of the first bounce high. From there, price falls a third time but fails to reach the depth of the head, instead bottoming out at a level that roughly matches the left shoulder’s depth. This higher low is the right shoulder.
Connecting the two bounce highs — between the left shoulder and the head, and between the head and the right shoulder — forms the neckline, which in the inverse pattern acts as a resistance level rather than support. A confirmed break and close above the neckline is generally read as the completion signal for the inverse pattern, indicating that selling pressure has been exhausted and buyers may be taking control.
What It Signals
The inverse head and shoulders pattern is classified as a bullish reversal pattern. Just as the standard pattern reflects buyers failing to sustain new highs (the failed right shoulder), the inverse pattern reflects sellers failing to push price to new lows on the third leg down. The same volume tendencies commonly discussed for the standard pattern are often described for the inverse version too — some analysts look for volume expansion on the breakout above the neckline as a supporting signal, though again, this is a commonly observed tendency rather than a guaranteed feature of every valid pattern.
Traders sometimes mistakenly treat the inverse head and shoulders as a lesser or secondary version of the “main” pattern, but it carries equal analytical weight. It shows up at trend bottoms exactly as often as the standard version shows up at trend tops, and the same rules for confirmation, false breaks, and risk management (covered next) apply symmetrically to both.
How to Trade a Head and Shoulders Pattern
The mechanics below describe how the pattern is commonly approached in technical analysis education. None of this is a guarantee of outcome — chart patterns describe probability-weighted price behavior, not certainties, and every element below should be treated as one input into a broader trading plan rather than a standalone signal.
Entry
For the standard (bearish) head and shoulders pattern, the commonly referenced entry point is a break and close below the neckline following the formation of the right shoulder. For the inverse (bullish) version, the mirrored entry point is a break and close above the neckline. Waiting for a full candle close beyond the neckline, rather than acting on an intraday touch or wick, is a widely used way to reduce the chance of reacting to a temporary spike that reverses back inside the pattern.
Confirmation
Two confirmation practices are commonly used alongside the neckline break itself:
- Volume on the breakout. An increase in volume as price breaks the neckline is often treated as supporting evidence that the move has real participation behind it, rather than being a low-conviction breakout likely to fail.
- A retest of the neckline. After breaking the neckline, price sometimes returns to test it from the other side before continuing in the breakout direction — in the standard pattern, the neckline is expected to act as new resistance on a retest; in the inverse pattern, as new support. Not every valid pattern retests, but when a retest does happen and holds, it’s commonly treated as added confirmation.
Stop-Loss Placement
For the standard head and shoulders pattern, a stop-loss is commonly placed above the high of the right shoulder — the logic being that if price pushes back up past the right shoulder’s peak after a supposed breakdown, the reversal thesis is likely invalidated. For the inverse pattern, the mirrored placement is below the low of the right shoulder. Stop-loss placement always involves a trade-off between risk exposure and giving the trade room to develop, and traders adjust exact placement based on their own risk tolerance and position sizing.
Target-Setting via the Measured Move
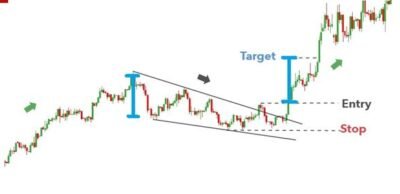
The most commonly referenced target method for a head and shoulders pattern is the measured move: the vertical distance from the head to the neckline is measured, then projected downward from the point where price breaks the neckline (for the standard pattern) or upward from the breakout point (for the inverse pattern). This gives an estimated target distance, not a guaranteed price level — price frequently falls short of, meets, or exceeds a measured-move target, and it should be treated as one reference point among several rather than a firm prediction.
What Is the Difference Between Head and Shoulders and a Double Top?
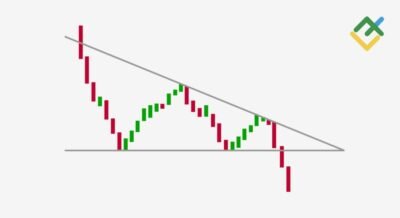
Both patterns are classic bearish reversal signals that form at the top of an uptrend, and both rely on a neckline break for confirmation, which is why they’re often mentioned in the same breath. The core distinction is structural: a double top pattern is a two-peak formation with roughly equal highs and a single pullback between them, while a head and shoulders pattern is a three-peak formation with a distinctly higher middle peak — the head — flanked by two lower, roughly symmetrical shoulders. In practical terms, head and shoulders is generally read as a slightly more developed or extended distribution pattern, since it requires three separate tests of the highs rather than two, while a double top tends to reflect a sharper, faster two-attempt rejection of resistance.
What Is the Difference Between Head and Shoulders and a Rising Wedge?
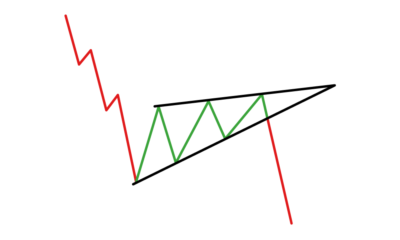
These two patterns are genuinely easy to confuse for newer traders because both frequently appear near the top of an uptrend and both can resolve bearishly. The distinction comes down to how the pattern is built. A rising wedge pattern is formed by two converging trendlines — a gradual squeeze where the range between support and resistance narrows over time as price grinds higher on decreasing momentum. A head and shoulders pattern, by contrast, is built from three distinct peaks and a flat or gently sloped neckline — it’s a structural reversal defined by a failed higher high (the right shoulder), not a narrowing squeeze. If you’re looking at converging trendlines that are compressing the price range, you’re likely looking at a wedge; if you’re looking at three separated peaks with a clear middle high, you’re likely looking at head and shoulders.
Risks and Limitations of Trading Head and Shoulders
Head and shoulders is one of the more widely taught chart patterns — and also one of the more commonly overstated in lower-quality trading content, where it’s sometimes framed as a near-guaranteed reversal signal. It isn’t. Like every chart pattern, it describes a historical tendency in price behavior, not a certainty, and it comes with real limitations that are worth taking seriously before trading around it.
False and Failed Patterns
Head and shoulders is one of the more subjective classic patterns to identify consistently. Because the pattern relies on judging whether two shoulders are “roughly” symmetrical and whether a neckline is meaningfully broken, different traders can look at the same chart and disagree on whether a valid pattern is actually present. Failed patterns — where price breaks the neckline but then reverses back through it, or where the “right shoulder” turns out to be the start of a new leg higher rather than a genuine reversal signal — are a well-documented risk with this pattern specifically, more so than with some more mechanically rigid patterns.
Forcing the Pattern
Because the head and shoulders shape is so visually familiar, it’s easy to start seeing it on charts where the structure doesn’t actually hold up — shoulders that are wildly mismatched in height, a head that isn’t clearly the highest point, or a neckline that has to be drawn at an awkward angle to make the pieces fit. Forcing a pattern onto a chart that doesn’t clearly support it is one of the most common ways this setup leads to poor trade decisions. If the shoulders, head, and neckline aren’t reasonably clear without significant interpretation, it’s often better to treat the setup as ambiguous rather than assume the pattern is present.
The Need for Confirmation
Acting on the pattern before the neckline is actually broken and closed — rather than waiting for confirmation — meaningfully increases the risk of entering on a pattern that never completes. Volume and neckline-break confirmation, discussed in the trading section above, exist specifically to filter out some of this risk, though neither eliminates it entirely.
One Input Among Several
Even a textbook-clean head and shoulders pattern is best treated as one input among several in a broader analysis process — alongside factors like the broader trend context, support and resistance levels, and risk management rules — rather than a standalone reason to enter a trade. No chart pattern, including this one, offers a reliable percentage-based success rate that applies uniformly across markets, timeframes, and conditions, and claims that suggest otherwise should be treated with skepticism.
FAQs
How reliable is the head and shoulders pattern?
There’s no verified, universal reliability statistic for this pattern. It’s a widely studied reversal signal, but outcomes vary by market, timeframe, and confirmation used — treat it as probability-weighted, not guaranteed.
What is the neckline in a head and shoulders pattern?
The neckline connects the two pullback lows between the shoulders and the head. It acts as support in the standard pattern and resistance in the inverse version, and its break is the key confirmation signal.
Can a head and shoulders pattern fail?
Yes. Price can break the neckline and then reverse back through it, or a seemingly valid right shoulder can turn into a new higher high instead. False and failed patterns are a well-documented risk with this setup.
What is the difference between a head and shoulders pattern and a rectangle pattern?
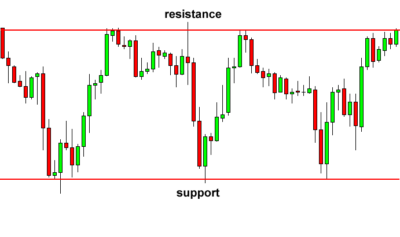
A rectangle pattern is an ongoing consolidation between flat support and resistance with no clear reversal shape, while head and shoulders is a defined three-peak structure signaling a specific reversal point.
What is the difference between a head and shoulders pattern and a triple top pattern?
Both are bearish reversal patterns that form at the top of an uptrend, but the peak structure differs. Head and shoulders has three peaks with a distinctly higher middle peak, while a triple top pattern has three roughly equal peaks at the same resistance level. That middle-peak height is the fastest way to tell the two apart on a chart.
Key Takeaways
- A head and shoulders pattern is a three-peak reversal signal — left shoulder, higher head, right shoulder — connected by a neckline, typically forming at the top of an uptrend.
- The inverse head and shoulders is the bullish mirror image, built from three troughs at the bottom of a downtrend, and deserves equal analytical weight to the standard version.
- Confirmation matters: a close beyond the neckline, ideally supported by volume and/or a neckline retest, is commonly used before treating the pattern as valid.
- Stop-loss placement beyond the right shoulder and measured-move target projection (head-to-neckline distance) are the standard risk and target framework — neither guarantees an outcome.
- This pattern is genuinely more subjective to identify than some others, and false/failed patterns are a well-documented risk — treat it as one input among several, not a standalone signal.
Summary
The head and shoulders pattern — and its bullish mirror image, the inverse head and shoulders — are among the most recognized reversal signals in technical analysis, built from a simple three-peak (or three-trough) structure and a neckline that defines the confirmation point. The standard version signals a potential shift from an uptrend to a downtrend at the top of the market; the inverse version signals the same kind of shift from a downtrend to an uptrend at the bottom. Both are traded using the same core framework: wait for a confirmed neckline break, look for supporting volume, place a stop beyond the relevant shoulder, and use the measured move as a reference target rather than a promise. Like any chart pattern, it works best as one part of a broader analysis approach rather than a signal traded in isolation.
If you’re still building your foundation in chart reading, our forex trading basics guide is a good starting point, and you can continue building out your pattern knowledge with our guide to the rising wedge pattern.