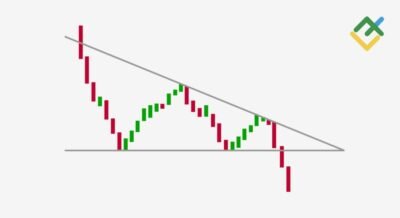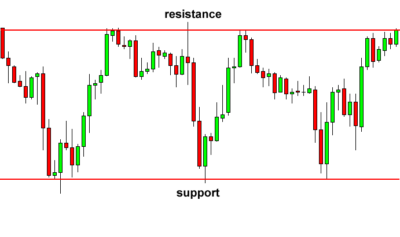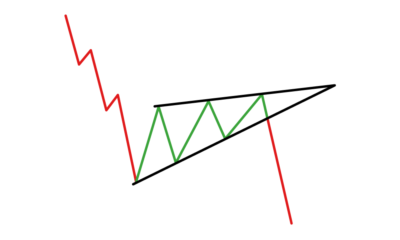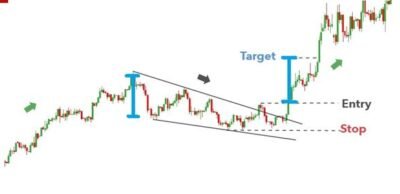
A triple top is a bearish reversal pattern where price tests a resistance level three times without breaking through; a triple bottom is its bullish mirror image, where price tests a support level three times without breaking below it. Both are rarer, longer-forming extensions of the double top and double bottom pattern, and both only confirm once the neckline between the extremes actually breaks.
If you’ve already read the site’s guide to the double top and double bottom pattern, the triple top and triple bottom will feel immediately familiar — they share the same neckline logic, the same reliance on a confirmed break rather than the shape alone, and the same measured-move approach to setting a target. What’s different is the number of tests: two peaks or troughs become three, one intervening pullback becomes two, and the whole pattern typically takes longer to develop. This article covers what these patterns look like, how they form, how traders approach entries and exits, where the pattern is genuinely distinct from its double-pattern sibling, and where it can go wrong. If you’re newer to chart patterns, it’s worth working through forex trading basics first.
What Is a Triple Top Pattern?
A triple top is a bearish reversal pattern that forms after an extended uptrend, when price rallies to a resistance level three separate times and fails to break meaningfully above it on any of the three attempts.
Visually, a triple top looks like three roughly equal peaks side by side, separated by two moderate pullbacks — sometimes described as a rounded or flattened “W-M” silhouette, though the cleanest way to picture it is simply three summits of similar height standing in a row, with two valleys between them. The three peaks don’t need to line up with perfect precision; as with the double top, small variations in height are normal, and traders generally still consider the pattern valid provided none of the later peaks pushes convincingly above the earlier ones. What separates a triple top from an ordinary double top isn’t a stricter height requirement — it’s the extra test. A double top stops after the second peak fails; a triple top keeps going, pulls back a second time, and then fails a third time at essentially the same level.
What the pattern signals is an extension of the double top’s logic, not a different one: buyers tried to push price above a resistance level and failed, not once, not twice, but three times. That third failure is commonly read as a stronger exhaustion-of-buying-pressure signal than a double top produces, precisely because the level has now held under repeated pressure rather than just a single retest. This is a matter of common interpretation among technical traders, not a proven statistical edge — there is no reliable, cited data showing a triple top resolves more accurately than a double top. A triple top is not confirmed the moment three peaks appear, either — as with its double-pattern sibling, it isn’t complete until price actually breaks below the support level connecting the two pullback lows (the neckline, covered in the next section).
What Is a Triple Bottom Pattern?
A triple bottom is the bullish mirror image of a triple top. It forms after an extended downtrend, when price falls to a support level three separate times and fails to break meaningfully below it on any of the three attempts.
Visually, a triple bottom looks like three roughly equal troughs in a row, separated by two moderate bounces — the inverse silhouette of the triple top, three basins of similar depth with two intervening high points. As with the triple top, the three troughs rarely align with exact precision; a reasonably close third test is typically enough for traders to consider the pattern intact, provided it doesn’t clearly undercut the prior lows. The distinguishing feature, again, is the extra test relative to a double bottom: where a double bottom completes its structure after the second trough holds, a triple bottom pushes on through a second bounce and a third test of support before the pattern’s shape is complete.
The signal here mirrors the triple top exactly, in the opposite direction: sellers tried to push price below a support level three times and failed on every attempt. That repeated failure is commonly read as a stronger exhaustion-of-selling-pressure signal than a double bottom produces, on the same logic — three failed tests of a level is generally taken as more convincing evidence of genuine demand at that price than two, though this remains a common interpretation rather than a backed statistical claim. Just like the triple top, a triple bottom isn’t confirmed by the three troughs alone. Confirmation comes only when price breaks above the resistance level connecting the two pullback highs between the troughs — the neckline.
How Do Triple Top and Triple Bottom Patterns Form?
Both patterns follow the same structural sequence, inverted depending on direction, and the sequence is one step longer than the double top or double bottom equivalent. Walking through it step by step makes it easier to recognize a genuine triple top or triple bottom developing on a live chart, rather than only identifying it in hindsight once all three tests are already visible.
1. The First Peak or Trough
In a triple top, this is the initial rally that reaches a resistance level and stalls. In a triple bottom, it’s the initial decline that reaches a support level and stalls. This first extreme sets the reference point that both later tests will be measured against, exactly as it does in a double top or double bottom — the difference only becomes apparent later in the sequence.
2. The First Pullback to the Neckline
After the first peak or trough, price retraces in the opposite direction and finds a temporary support or resistance level. In a triple top, this pullback low is the first of two points that will eventually define the neckline; in a triple bottom, it’s the first of two pullback highs that will do the same. At this stage in isolation, the chart is indistinguishable from the opening of an ordinary double top or double bottom — there is no way yet to know whether a second test will complete a double pattern or whether a third test is still to come.
3. The Second Test
Price moves back toward the original extreme and tests it a second time, failing to meaningfully exceed the first peak (triple top) or meaningfully break below the first trough (triple bottom). In a double top or double bottom, this second failed test would be the pattern’s completion point, pending only the neckline break. In a developing triple top or triple bottom, it isn’t — price instead pulls back again rather than breaking the neckline immediately.
4. The Second Pullback
This is the step that has no equivalent in a double top or double bottom, and it’s the clearest structural tell that a triple pattern may be forming rather than a double one. After the second peak or trough fails to exceed the first, price pulls back again to a level close to the first pullback, rather than breaking through the neckline. A double top or double bottom that instead breaks the neckline at this point simply completes as a double pattern; it’s only when price pulls back a second time without breaking the neckline that a triple top or triple bottom becomes a live possibility.
5. The Third Test
Price moves back toward the original extreme one final time and, for the pattern to qualify as a triple top or triple bottom, fails a third time to meaningfully exceed the prior peaks (triple top) or meaningfully break below the prior troughs (triple bottom). This third failure at essentially the same level is what gives the pattern its defining three-peak or three-trough structure, and it’s also the reason triple tops and triple bottoms take noticeably longer to complete than their double counterparts — there’s an entire extra round-trip between the second and third tests that a double top or double bottom simply doesn’t require.
6. The Neckline Break
As with the double top and double bottom, the pattern only confirms once price actually breaks through the neckline connecting the two pullback points — downward for a triple top, upward for a triple bottom. Until that break happens, three roughly equal peaks or troughs are still just an unconfirmed formation, and price could resume the original trend rather than reversing. The neckline break represents the same shift in control described in the double top and double bottom pattern: the side that had been defending the neckline through both pullbacks is finally overwhelmed, and the opposing side takes over the broader move rather than just capping or defending a local test.
Volume Behavior
As with the double top and double bottom, a commonly cited — though not universal — volume signature is progressively lower volume across the second and third peaks or troughs compared to the first, consistent with each successive failed attempt drawing less committed participation than the one before it. This isn’t a guaranteed feature of every triple top or triple bottom, and its absence shouldn’t be read as automatically invalidating the pattern. When it is present across all three tests, it offers two data points of decline (first-to-second, second-to-third) rather than the single one a double pattern can show.
Why the Extra Test Matters for Timing
The most practical consequence of the additional test is time. A double top or double bottom can complete in the span of two rallies or declines and one pullback; a triple pattern requires three rallies or declines and two pullbacks before the neckline break is even possible. On the same timeframe, that means a triple pattern typically takes meaningfully longer to play out — a genuinely distinguishing characteristic that matters for how patiently a trader has to wait before the setup is even eligible to trigger, not just an academic detail about peak count.
How to Trade Triple Top and Triple Bottom Patterns
The core trading logic mirrors the double top and double bottom pattern closely, because the confirmation mechanism — the neckline break — is identical in both pattern families. What differs is where the stop-loss sits, given there are now three extremes instead of two. As with any chart pattern, none of the following should be read as a guarantee of a particular outcome — it’s a description of common approaches, not a promise of results.
Entry
The typical entry trigger is a break and close beyond the neckline: a close below the neckline for a triple top, or a close above the neckline for a triple bottom. As with the double top and double bottom, waiting for a full candle close beyond the neckline — rather than acting on an intraday wick or a partial break — is a common way traders try to filter out false signals.
Confirmation
Beyond the neckline break itself, traders commonly look for the same two forms of secondary confirmation used on the double top and double bottom: volume on the breakout candle, and a retest of the neckline from the opposite side before price continues in the breakout direction. Given that a triple pattern has already demonstrated three failed tests of the same level before the breakout even occurs, some traders treat its neckline break as carrying somewhat more weight than an equivalent break on a double pattern.
Stop-Loss Placement
For a triple top, a stop-loss is commonly placed above the third peak — if price reclaims that level, the bearish thesis behind the pattern is generally considered invalidated. For a triple bottom, a stop-loss is commonly placed below the third trough, on the same logic in reverse. This is a meaningful practical difference from the double top and double bottom: the reference point for stop placement is the third extreme, not the second, which can put the stop further from the entry than it would be on a double pattern with a similarly sized first peak or trough, simply because more price action has unfolded by the time the pattern confirms.
Target-Setting via the Measured Move
The measured-move approach carries over directly from the double top and double bottom: take the vertical distance from a peak (or trough) to the neckline, then project that same distance from the point where price breaks the neckline — downward for a triple top, upward for a triple bottom. Because the three peaks (or troughs) should be similar in height, the measured distance is broadly consistent regardless of which one is used. This is a commonly used technique for estimating a potential target, not a formula that guarantees price will reach that level.
A Worked Example: Trading a Triple Top
The mechanics above are easier to follow with numbers attached. The walk-through below is hypothetical and illustrative only — not a record of an actual trade; the price levels are chosen purely to make the entry, stop, and target math easy to follow.
Suppose a currency pair has been in an uptrend and rallies to 1.1200, where it stalls and pulls back — the first peak. It retraces to 1.1080, the first pullback low, before rallying again to roughly 1.1210, a second peak that fails to meaningfully exceed the first. Price pulls back a second time, to around 1.1090, then rallies a third time to approximately 1.1195 — a third peak that again fails to convincingly clear the first two. From there, price turns down, breaks through the neckline (roughly 1.1080–1.1090) and closes a full candle below it, which is the entry trigger.
- Entry: on the close below the neckline (around 1.1085), or after a shallow retest of the neckline zone that holds as resistance before price continues lower.
- Stop-loss: placed above the third peak, for example around 1.1225 — if price reclaims the third peak, the bearish case behind the pattern is considered invalidated.
- Measured-move target: the distance from a representative peak (roughly 1.1200) to the neckline (roughly 1.1085) is about 115 pips. Projected downward from the breakout point at 1.1085, that gives a target of approximately 1.0970.
- Risk framing: in this example, the distance from entry (1.1085) to the stop (1.1225) is roughly 140 pips, against a projected move of roughly 115 pips to the measured-move target — a reminder that the measured move is an estimate of potential reward, not a promise, and traders typically weigh it against their own stop distance and position sizing rather than assuming the projected target will be reached.
A triple bottom would follow the identical logic in reverse: entry on a close above the neckline, stop below the third trough, and a measured-move target projected upward by the same vertical distance from trough to neckline.
What Is the Difference Between a Triple Top and a Double Top?
A triple top and a double top and double bottom pattern share the same underlying logic — repeated failed tests of a resistance level followed by a neckline break — but differ in how many tests occur before that break. A double top has two peaks separated by a single intervening pullback; a triple top has three peaks separated by two intervening pullbacks. Because it requires an extra round-trip between the second and third tests, a triple top generally takes longer to form than a double top on a comparable timeframe, and the extra failed test is commonly read as a marginally stronger reversal signal — the resistance level has now held under three separate attempts rather than two — though this is an interpretation of conviction, not a proven claim that triple tops resolve more reliably. In practice, this also means a chart that looks like a double top after its second peak may still turn into a triple top if price pulls back and tests the level a third time without breaking the neckline first, which is exactly the scenario covered in the risks section below.
What Is the Difference Between a Triple Bottom and a Head and Shoulders Pattern?
A triple bottom and a head and shoulders pattern can be visually confused at a glance because both are multi-extreme reversal patterns built from three tests of a level, but the shapes are structurally distinct. A head and shoulders pattern has a distinctly higher middle peak (the head) flanked by two lower, roughly matching shoulders — the three peaks are deliberately unequal, with the middle one standing apart. A triple bottom (and, by the same logic, a triple top) has three roughly equal extremes with no dominant middle point — all three troughs sit at approximately the same depth, and none is meant to stand out from the other two. If the middle test in a three-test sequence is noticeably more extreme than the two flanking it, that’s a signal to reconsider whether the pattern forming is actually a head and shoulders (or its inverse) rather than a triple top or triple bottom.
Risks and Limitations of Trading Triple Top and Triple Bottom Patterns
Like the double top and double bottom, triple tops and triple bottoms fail, and treating either as a guaranteed reversal signal — regardless of how many times the level has been tested — is a common and costly mistake.
False breakouts and failed necklines. Price can break the neckline and then reverse straight back through it, trapping traders who entered on the initial break. This is a common failure mode for both patterns and is a large part of why many traders wait for a candle close beyond the neckline, or a retest that holds, rather than acting on the first sign of a break.
Misreading a developing double top or double bottom as a triple, or vice versa. Because a triple top and a double top look identical through their first two peaks, there’s no way to know which pattern is actually forming until either the neckline breaks (completing a double top) or price pulls back and tests the level a third time (opening the possibility of a triple top). Traders sometimes anticipate a triple top prematurely — expecting a third test that never comes, and missing or hesitating on a valid double-top neckline break that plays out first. The reverse mistake is just as common: assuming a double top has completed and acting on it, only to watch price pull back and set up a third test instead. Waiting for the actual neckline break, rather than pre-labeling the pattern by peak count alone, is the most reliable way to avoid both versions of this mistake.
Force-fitting the pattern onto price action that isn’t one. Three roughly equal tests of a level can also simply be ordinary range-bound consolidation, or the early stages of a rectangle pattern. Labeling a chart a triple top or triple bottom before the neckline actually breaks — purely because three peaks or troughs are visible — is a frequent source of false signals, and it’s a mistake that’s easier to make here than on a double pattern, because there’s more price history to point to and rationalize.
The need for confirmation. Because the pattern isn’t confirmed until the neckline breaks, acting on the shape of three peaks or three troughs alone, without waiting for that break (and ideally without some volume or retest confirmation), significantly increases the risk of trading a pattern that never actually completes.
Rarity and the temptation to overstate the signal. Triple tops and triple bottoms are genuinely rarer than double tops and double bottoms, because price has to fail at the same level three times before the pattern is even eligible to complete. That rarity doesn’t make a confirmed triple pattern a stronger guarantee of reversal — it simply means fewer clean examples exist to trade, and traders should be cautious about forcing an ambiguous chart into a triple-pattern label because the idea of a “rarer, stronger” signal is appealing.
One input among several. A triple top or triple bottom pattern reflects price structure on a chart; it does not account for fundamental drivers, broader market context, or risk management on its own. As with the other pattern posts on this site, this is best treated as one input in a broader analysis process rather than a standalone trading signal.
FAQs
Is a triple top bullish or bearish?
A triple top is bearish. It forms at the top of an uptrend and signals a potential reversal from bullish to bearish price action once the neckline breaks.
How rare is the triple top/triple bottom pattern compared to the double top/bottom?
Triple tops and triple bottoms are genuinely rarer, since price must fail at the same level three times, not two, before the pattern can even complete.
What is the neckline in a triple top pattern?
The neckline is the support level formed by the two pullback lows between the three peaks. A close below it is generally treated as confirming the pattern.
What is the difference between a triple bottom and a rounding bottom pattern?
A triple bottom has three distinct, roughly equal troughs with sharp pullbacks between them, while a rounding bottom forms one gradual, curved trough over a longer, smoother decline and recovery.
Key Takeaways
- A triple top is a bearish reversal pattern with three roughly equal peaks at the top of an uptrend; a triple bottom is its bullish mirror image with three roughly equal troughs at the bottom of a downtrend.
- Both patterns extend the double top/double bottom logic by one extra test and one extra pullback, which means they typically take longer to form and are genuinely rarer in real price action.
- Neither pattern is confirmed until the neckline breaks — three failed tests alone are not a trading signal.
- Stop-losses reference the third peak or trough (not the second), and targets are estimated using the same measured-move technique used on the double top and double bottom.
- The most common mistake is misreading an ordinary double top or double bottom as a developing triple pattern, or vice versa, before the neckline actually breaks.
Summary
The triple top and triple bottom pattern are the rarer, longer-forming siblings of the double top and double bottom pattern: the same neckline-and-confirmation logic, extended by one additional failed test and one additional pullback. A triple top forms at the top of an uptrend and points to a possible bearish shift after three failed attempts at resistance; a triple bottom is its bullish mirror at the bottom of a downtrend. The extra test is commonly read as a somewhat stronger signal of exhausted pressure than a double pattern provides — but it’s an interpretation, not a guarantee, and the pattern still isn’t complete until the neckline actually breaks. If you haven’t already, read the double top and double bottom pattern as the natural companion piece, or go back to forex trading basics if you’re still building the foundation these reversal patterns sit on.