Symmetrical Triangle Pattern: What It Is and How to Trade
A symmetrical triangle pattern is a neutral consolidation structure formed by a descending resistance line and an ascending support line converging toward an apex. Unlike the ascending or descending triangle, it carries no inherent directional bias — the eventual breakout direction has to be confirmed with price and volume, not assumed from the shape alone. Traders use the pattern to anticipate an expansion in volatility, then wait for a confirmed break before committing to either side.
That “no inherent bias” point is worth sitting with before going any further, because it’s the single detail that separates this pattern from its two triangle siblings. An ascending triangle leans bullish because its flat resistance line shows sellers pinned to one price while buyers get progressively more aggressive. A descending triangle leans bearish for the mirror-image reason. A symmetrical triangle has neither tell — both sides are giving ground at a similar rate, which is why the shape by itself doesn’t say which way it’s going to break. That’s not a weakness of the pattern so much as an honest description of what a genuine period of indecision looks like on a chart, and treating it as anything more directional than that is where traders get into trouble.
This guide covers what a symmetrical triangle pattern looks like, how it forms, whether it should be read as bullish or bearish, and how to build a trade plan around it — entries, stop-loss placement, and target-setting included. It also compares the pattern against its two closest relatives, covers its real limitations, and answers the questions traders ask most often about it. If you’re new to chart patterns generally, the forex trading basics guide is a useful starting point before diving into pattern-specific mechanics.
What Is a Symmetrical Triangle Pattern?
A symmetrical triangle pattern is a price consolidation structure defined by two converging trendlines of roughly similar slope: a descending line connecting a series of lower highs, and an ascending line connecting a series of higher lows. Visually, the pattern looks like a triangle lying on its side with both edges angled toward each other, narrowing toward a single point — the apex — rather than one flat line and one sloped line as in the ascending or descending triangle.
The shape reflects a genuine standoff between buyers and sellers rather than either side clearly gaining ground. Each time price rallies, it’s turned back a little sooner than the last rally — hence the lower highs. Each time price falls, it’s supported a little sooner than the last decline — hence the higher lows. Neither the highs nor the lows are holding at a fixed level the way they do in the directional triangles; both are compressing toward the middle. That symmetry is exactly why the pattern is read as a pause or indecision phase rather than a directional signal in its own right — the chart is telling you that supply and demand are roughly balanced at that moment, not which way the balance is about to tip.
Because it most often appears as a pause within an existing trend rather than a standalone reversal setup, the symmetrical triangle is generally classified as a continuation pattern. That classification comes with an important caveat covered in full in the bullish-vs-bearish section below: “continuation” describes the more common outcome, not a guaranteed one.
How Does a Symmetrical Triangle Form?
A symmetrical triangle builds gradually across a sequence of price swings as both trendlines compress toward the apex. The formation typically develops in a repeatable pattern:
1. An initial swing high and swing low establish the outer range. Price makes a high, pulls back, then makes a low, before turning higher again. These two points are the first anchors for what will become the descending and ascending trendlines, though neither line can be drawn with any confidence yet.
2. A lower high forms. Rather than reaching the same level as the initial high, the next rally falls short and reverses earlier. This lower high is the second point on the descending trendline.
3. A higher low forms. The subsequent pullback finds buyers sooner than the initial low did, creating a higher low. This is the second point on the ascending trendline.
4. The sequence repeats, compressing the range. Each new high is lower than the one before it, and each new low is higher than the one before it. Connecting these points produces two converging trendlines of comparable steepness — a materially different look from the ascending triangle’s flat top or the descending triangle’s flat bottom, where one side of the range stays fixed while the other moves.
5. Volume typically contracts as the pattern tightens. As with the other triangle patterns, trading volume tends to shrink as price compresses toward the apex — a natural reflection of hesitation as the range narrows and fewer traders commit to new positions ahead of the eventual breakout. A pickup in volume on the breakout, in whichever direction it occurs, is generally treated as a materially stronger confirmation signal than a breakout on thin volume.
The pattern is only considered structurally complete once both trendlines have at least two touches each — two lower highs on the descending line and two higher lows on the ascending line. A single lower high paired with a single higher low isn’t enough to draw a reliable triangle; traders generally wait for the compression to develop more fully, and for the two lines to display genuinely comparable slopes, before treating the setup as tradeable. If one line is clearly flat while the other slopes, that’s an ascending or descending triangle, not a symmetrical one — a distinction covered in detail in the comparison sections below.
Is the Symmetrical Triangle Bullish or Bearish?
A symmetrical triangle is a continuation pattern that more often breaks in the direction of the prevailing trend, but it can break either way — and that lack of a built-in directional bias is exactly what separates it from the ascending and descending triangle. The breakout direction has to be confirmed with price action and volume; it should never be assumed from the shape of the pattern alone.
This is a deliberately more careful answer than the one traders usually get for the ascending or descending triangle, and it’s worth being precise about why. Both directional triangles have a structural tell built into their shape: a flat resistance line signals sellers defending one level while buyers push higher (ascending, generally bullish); a flat support line signals buyers defending one level while sellers push lower (descending, generally bearish). The symmetrical triangle has no equivalent tell. Both trendlines are moving toward each other at a comparable rate, which means the pattern’s shape alone doesn’t reveal which side is losing ground faster.
In practice, when a symmetrical triangle forms as a pause within a clear existing trend, it more often resolves as a continuation of that trend — which is why it’s classified as a continuation pattern in most technical analysis references, the same broad family as the ascending and descending triangle. But “more often” is doing real work in that sentence. Because the pattern lacks a built-in bias, breakouts against the prevailing trend are meaningfully more common here than they are with the ascending or descending triangle, where the flat line gives a clearer read on which side is losing the standoff. Treating “it formed in an uptrend, so it’ll break up” as a safe assumption is precisely the kind of oversimplification this pattern punishes. The honest approach is to treat the prevailing trend as one input among several, wait for a confirmed break with volume behind it, and size the position accordingly rather than pre-committing to a direction before the market has actually shown its hand.
How to Trade a Symmetrical Triangle Pattern
Trading a symmetrical triangle follows a structured, breakout-based approach similar to the other triangle patterns, with one added layer of discipline: because the shape itself doesn’t signal a direction, confirmation matters more here than it does anywhere else in the triangle family. None of the steps below guarantee a profitable outcome — chart patterns describe probability and structure, not certainty.
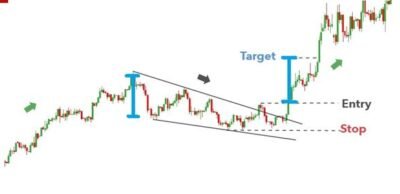
Entry: wait for a breakout beyond either trendline. The standard approach is to enter only after price closes convincingly beyond the descending trendline (for a bullish break) or the ascending trendline (for a bearish break), rather than guessing the direction ahead of time. Entering before the breakout is confirmed means picking a side in a pattern that, by definition, hasn’t picked one yet. Where the broader trend and the breakout direction agree, that alignment is generally treated as a stronger setup than a breakout that runs counter to the prevailing trend.
Confirmation: look for volume expansion and/or a retest. A breakout accompanied by a clear increase in volume is considered materially more reliable than one on light volume, since it suggests genuine participation behind the move rather than a low-conviction spike through a converging trendline. Some traders also wait for price to break out, pull back to retest the broken trendline (which often becomes support or resistance in its new role), and hold that level before entering — a more conservative approach that sacrifices some of the initial move for additional confirmation that the breakout is genuine rather than a false start.
Stop-loss placement. A common approach is to place the stop-loss beyond the opposite trendline, or just beyond the most recent swing point on that side. If price breaks above the descending trendline, the stop sits below the most recent higher low or below the ascending trendline itself — the point at which the breakout’s logic would be invalidated if price traded back through it. The mirror applies for a downside break.
Target-setting via the measured move. The most widely used method for projecting a target is the same “measured move” approach used across the triangle family: measure the vertical height of the triangle at its widest point (the distance between the first swing high and first swing low), then project that same distance from the breakout point in the direction of the break. This gives a technical reference level, not a promise — price can fall short of the target or run well past it depending on broader market conditions.
As with any technical setup, position sizing and risk-per-trade discipline matter more to long-term outcomes than any single pattern’s win rate. Given that this pattern specifically lacks a built-in directional bias, that discipline matters even more here than with the ascending or descending triangle — there is no structural shortcut for skipping confirmation.
Putting the mechanics together: an illustrative walk-through. The individual rules above are easier to apply as a single sequence rather than four separate decisions, so it helps to walk through how they interact — using round, illustrative levels rather than a real trade, since actual entries depend entirely on the instrument and timeframe in front of you. Suppose a currency pair has carved out two lower highs and two higher lows, with both trendlines converging at a comparable angle and volume visibly thinning as the range narrows. The vertical distance between the very first swing high and the very first swing low becomes the yardstick for the rest of the plan, regardless of which way the eventual breakout goes. If price then closes convincingly above the descending trendline on a visible pickup in volume, and that break is running in the same direction as the broader trend, that’s the higher-confidence version of the setup a breakout trader would act on; a more conservative trader instead waits to see whether price pulls back to retest the old descending trendline as new support before entering. Either way, the stop-loss goes below the most recent higher low or just under the ascending trendline itself. The target is then set by projecting the triangle’s measured height upward from the breakout point. If instead price had broken down through the ascending trendline, the entire plan mirrors in the opposite direction — stop above the most recent lower high, target projected downward by the same measured distance. The value of walking through it this way isn’t the specific numbers — it’s seeing that the pattern doesn’t force a directional guess; it waits for the market to declare one, and only then builds a stop and target around that confirmed direction.
What Is the Difference Between a Symmetrical Triangle and an Ascending Triangle?
A symmetrical triangle and an ascending triangle pattern share the basic triangle shape but differ in one structurally important way: an ascending triangle has a flat resistance line on top with a rising support line underneath, giving it a directional bullish bias built into the pattern itself. A symmetrical triangle has no flat line at all — both the resistance line and the support line are sloping toward each other, one falling and one rising, which is exactly why it carries no inherent directional bias the way the ascending triangle does.
The practical consequence is confirmation discipline. With an ascending triangle, the flat resistance line gives traders a specific, repeatedly-tested level to watch, and the pattern’s own structure already leans bullish before the breakout even happens. With a symmetrical triangle, there is no equivalent fixed level doing that work — both boundaries are moving, so a trader can’t lean on the shape itself the way they can with the ascending triangle’s flat top. Confusing the two — assuming a symmetrical triangle carries the same bullish lean as an ascending triangle simply because both slope upward on one side — is a real identification error, and one that matters because it changes how much weight a trader should put on the pattern’s structure alone versus waiting for the breakout to confirm direction.
What Is the Difference Between a Symmetrical Triangle and a Descending Triangle?
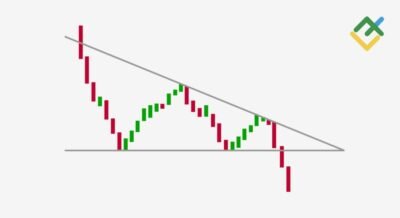
The comparison against the descending triangle pattern runs in the opposite direction but makes the same underlying point. A descending triangle has a flat support line on the bottom with a falling resistance line above it, giving it a directional bearish bias built into the pattern’s structure. A symmetrical triangle again has neither line flat — both the resistance line and the support line are sloped, converging toward each other rather than one holding a fixed level while the other moves.
Because the descending triangle’s flat support line represents a genuinely tested, defended price level, traders can treat repeated failures to hold that level as meaningful evidence of building bearish pressure well before the actual breakdown. A symmetrical triangle offers no equivalent fixed reference point on either side, which is precisely why its breakout direction needs independent confirmation rather than an assumption drawn from the shape. The practical takeaway is the same as in the ascending triangle comparison above: whenever one line in a triangle pattern is genuinely flat, that flat line is carrying directional information; when neither line is flat, that information isn’t there, and the pattern needs to be traded more cautiously as a result.
Risks and Limitations of Trading the Symmetrical Triangle
Like every chart pattern, the symmetrical triangle is a probability tool, not a certainty — and its lack of a built-in directional bias makes several of the usual triangle risks somewhat more pronounced here than with the ascending or descending triangle.
False breakouts are more common here than in directional triangles. Because there’s no flat, repeatedly-defended line to lean on, price can push beyond either trendline, trigger breakout entries, and then reverse back inside the triangle more readily than it tends to with the ascending or descending triangle. This is precisely why volume confirmation and/or a retest of the broken trendline are treated as closer to essential here, rather than optional extra confirmation.
Anticipating the breakout direction before it’s confirmed is a specific, avoidable mistake. Because the pattern’s shape doesn’t reveal a bias, entering a position based on a guess about which way it “should” break — reasoning from the prevailing trend alone, without waiting for an actual confirmed close beyond a trendline — exposes a trader to exactly the failure mode this pattern is most prone to. The prevailing trend is a reasonable input to weigh, but it is not a substitute for confirmation.
Volume confirmation isn’t optional context — it materially affects reliability. A breakout on unusually low volume carries a meaningfully higher chance of failing or reversing than one accompanied by a clear increase in participation, and that gap matters even more for a pattern that offers no directional lean of its own to fall back on.
Pattern reliability degrades in choppy or low-liquidity conditions. In ranging or illiquid markets, price can repeatedly poke beyond one trendline and fail, generating a series of false signals rather than one clean breakout. This is particularly relevant in forex pairs during low-liquidity sessions or around major news events, where volatility can produce breakout-shaped price action that has little to do with the underlying supply/demand balance the pattern is meant to capture.
Reliability tends to degrade the closer price gets to the apex. Both trendlines are converging toward a single point by definition, and the pattern loses much of its usefulness the nearer price trades to that apex. As the range compresses toward the very tip of the triangle, there’s less room left for a meaningful breakout to develop, and price is more likely to simply chop through both lines without producing a clean directional move. Many traders treat a very late breakout — one that occurs close to where the lines would actually meet — with extra caution, since much of the pattern’s structural information has already been used up without resolution by that point.
The pattern is one input, not a standalone signal. A symmetrical triangle should generally be assessed alongside the broader trend, key support/resistance levels, and other technical or fundamental context — not treated as a self-sufficient trading signal, and even less so than the directional triangles given its lack of built-in bias. Relying on any single chart pattern in isolation, without a defined stop-loss and sound position sizing, runs counter to basic risk management regardless of how textbook the pattern looks.
A breakout can gap past the level that was supposed to define the stop-loss. The stop-loss and target framework above assumes price moves through the breakout level in a relatively continuous way, but that isn’t guaranteed — particularly in forex, where news events, session opens, or weekend gaps can cause price to jump from one level to another without trading through the prices in between. If price gaps sharply beyond a trendline, or gaps back through it against an open position, the intended stop-loss level may simply be skipped, and the trade is filled at a materially worse price than planned. This is a genuine limitation of the pattern’s mechanical rules, not just a rare edge case, and it’s a core reason position sizing and risk-per-trade discipline — rather than the stop-loss level alone — are what actually cap the damage from a worst-case outcome.
None of this makes the symmetrical triangle unreliable as a concept — it remains one of the more widely referenced consolidation structures in technical analysis, precisely because it describes a genuine period of market indecision rather than forcing a directional read onto one. Like the other patterns in the triangle family (the ascending triangle pattern and descending triangle among them), it works best as part of a broader trade plan built around confirmation, rather than as an isolated trigger.
FAQs
What is the difference between a symmetrical triangle and a wedge pattern?
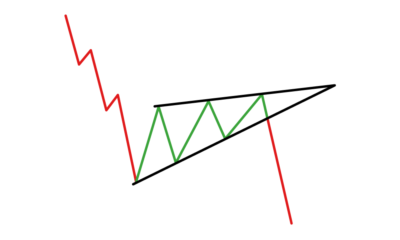
A symmetrical triangle has one line rising and one falling at similar angles with no directional bias. A rising wedge pattern has both lines sloping in the same direction (both up, or both down), which typically signals weakening momentum rather than neutral indecision.
How reliable is the symmetrical triangle pattern?
Reliability varies by market conditions and confirmation used. It’s a well-established consolidation pattern, but false breakouts are common — volume confirmation and risk management matter more than the shape alone.
Which direction does a symmetrical triangle usually break?
More often in the direction of the prevailing trend, but it can break either way. The direction should always be confirmed with a closed breakout and volume, never assumed in advance.
What timeframes work best for trading symmetrical triangles?
The pattern appears across timeframes, from intraday charts to weekly charts. Higher timeframes generally produce more reliable signals with fewer false breakouts than very short intraday timeframes.
Summary
A symmetrical triangle pattern forms when a descending resistance line and an ascending support line converge toward an apex, reflecting a genuine standoff between buyers and sellers rather than either side clearly gaining the upper hand. It’s generally classified as a continuation pattern that breaks more often in the direction of the prevailing trend, but — unlike the ascending or descending triangle — it carries no inherent directional bias, which makes confirmed entries, volume, and a defined stop-loss non-negotiable rather than optional extras. A sound trade plan waits for a confirmed break beyond either trendline before choosing a side, then pairs that entry with a stop beyond the opposite trendline and a measured-move target.
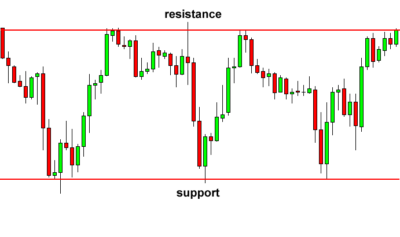
If you’re still building a foundation in chart-pattern basics, the forex trading for beginners guide is a good next stop. For a look at this pattern’s two directional relatives, see the ascending triangle pattern guide, or compare it against the rectangle chart pattern to see how a non-converging sideways range differs from a converging one.