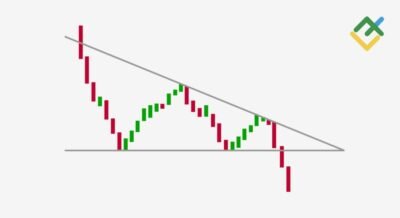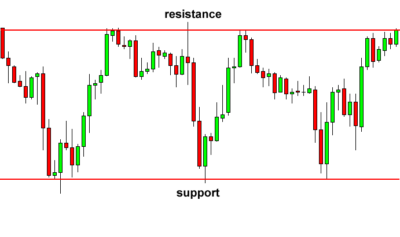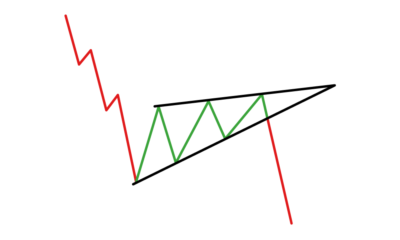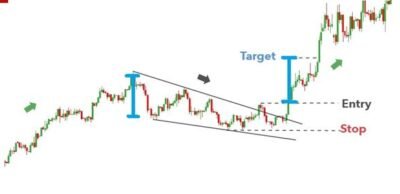
A bull flag is a brief, downward-sloping pause after a sharp rally that typically resolves higher, while a bear flag is a brief, upward-sloping pause after a sharp decline that typically resolves lower. Both are short-term continuation patterns built around the same two-part structure: a strong “flagpole” move, followed by a tight consolidation “flag” that leans against the trend before it resumes.
Traders study these two patterns together because they are mirror images of each other. A bull flag forms in an uptrend and signals a pause before the rally continues; a bear flag forms in a downtrend and signals a pause before the decline continues. Both are read using the same measured-move logic, and both carry the same core risk: the pause can fail and turn into a genuine reversal instead of a continuation. This guide walks through how each pattern forms, how they differ from the pennant and the rising wedge, and how the measured-move target is calculated — with the risks spelled out plainly rather than glossed over. If you’re new to reading price charts at all, it’s worth starting with forex trading basics before working through pattern-specific mechanics like these.
What Is a Bull Flag Pattern?
A bull flag is a continuation pattern that forms when a sharp, near-vertical rally (the flagpole) is followed by a brief, tight consolidation that slopes gently downward or sideways (the flag), before price resumes its original upward move.
Visually, the pattern looks exactly like its name suggests: a straight “pole” made of a fast, high-momentum upward push, topped by a small rectangular “flag” that drifts against the prevailing trend. The flag itself is bounded by two roughly parallel lines — an upper line connecting the minor swing highs of the pullback, and a lower line connecting the minor swing lows. Because both lines slope in the same direction at a similar angle, the channel stays a fairly constant width from start to end, which is what separates a flag from a converging shape like a pennant or a wedge (covered in the comparison sections below).
What a bull flag signals is not indecision in the way a symmetrical triangle can be — it’s usually read as a pause for breath within an established uptrend. After a strong impulsive move, some of the traders who bought early take partial profits, and some new buyers wait for a pullback rather than chasing the rally. That combination produces a shallow, controlled dip rather than a full trend reversal. The pattern is considered complete, and the continuation thesis reinforced, once price breaks back above the upper boundary of the flag channel — ideally accompanied by a pickup in trading volume, which suggests fresh buying interest is stepping back in rather than the move fizzling out on thin participation.
It’s worth being precise about what a bull flag does *not* guarantee: it is a probabilistic continuation setup, not a certainty. A tight, well-formed flag on declining volume within a clear uptrend is a more textbook example than a sloppy, wide consolidation that barely respects parallel boundaries — and even a textbook example can fail. Traders who treat the pattern as a signal to search for confirmation, rather than a green light on its own, tend to manage the risk of misreading it more effectively.
A few additional visual details separate a clean bull flag from a marginal one. The flagpole should be a genuinely distinct, near-vertical leg on the chart — if it’s hard to point to where the impulsive move starts and ends, the “flagpole” may just be ordinary trend noise rather than a real setup. The flag itself should also be noticeably smaller than the flagpole in both price range and, usually, in the number of candles it takes to form; a pullback that retraces a large percentage of the flagpole’s move, or that drags on for an extended period, starts to resemble a broader corrective phase rather than a tight flag.
What Is a Bear Flag Pattern?
A bear flag is the mirror-image continuation pattern: a sharp, near-vertical decline (the flagpole) followed by a brief, tight consolidation that drifts gently upward or sideways (the flag), before price resumes its original downward move.
The visual structure mirrors the bull flag exactly, just flipped. The flagpole is a fast, high-momentum drop — often driven by a burst of selling pressure or a negative catalyst. What follows is a small, rectangular consolidation channel that slopes up and to the right, bounded by two roughly parallel trendlines: an upper line connecting the minor swing highs of the bounce, and a lower line connecting the minor swing lows. As with the bull flag, both boundary lines run at a similar angle, which keeps the channel a consistent width — the defining visual trait that separates a flag from a pennant’s narrowing shape.
What a bear flag signals is a short pause within a still-dominant downtrend, not a bottom. After a sharp decline, some short-sellers close out positions to lock in gains, and some sideline buyers attempt a bounce, producing a brief corrective rally against the trend. That bounce tends to be shallow and controlled rather than a genuine trend reversal, provided the broader downtrend context remains intact. The pattern is considered complete, and the bearish continuation thesis reinforced, once price breaks back below the lower boundary of the flag channel — again, ideally on renewed volume, which suggests sellers are reasserting control rather than the bounce simply running out of buyers.
As with its bullish counterpart, a bear flag is a probability-weighted setup, not a promise. A sharp countertrend bounce that fails to hold above the flag’s upper boundary, or that drags on for far longer than a typical flag duration, starts to look less like a pause and more like the early stages of an actual reversal. Reading a bear flag well means weighing the quality of the flagpole, the tightness of the channel, and the volume pattern together — not treating any single element in isolation.
The same quality checks that apply to a bull flag apply here in reverse. A genuine bear-flag flagpole should be a sharp, clearly demarcated decline — a slow, grinding sell-off without a distinct fast leg doesn’t set up the same pattern. The bounce that forms the flag should retrace only a modest portion of the flagpole’s decline; a bounce that claws back the majority of the prior drop is behaving more like the start of a reversal than a shallow pause, regardless of how parallel its boundary lines look.
How Do Bull Flag and Bear Flag Patterns Form?
Both patterns share the same three-part mechanical sequence, just oriented in opposite directions.
1. The flagpole. This is the sharp, high-volume impulse move that kicks the pattern off — a strong rally for a bull flag, a strong decline for a bear flag. The flagpole is typically the most important structural element to identify correctly, because the eventual measured-move target is calculated directly from its height (covered in the next section). A flagpole should be a genuinely fast, high-momentum move — a slow grind higher or lower doesn’t produce the same pattern and doesn’t support the same measured-move logic.
2. The flag. Once the impulsive move exhausts itself, price consolidates in a tight channel that runs counter to (or sideways against) the flagpole’s direction — downward-sloping after a bull flagpole, upward-sloping after a bear flagpole. A genuine distinguishing characteristic of this stage, compared to most of the other chart patterns covered on this site, is duration: flags typically form over a matter of days rather than the multiple weeks it can take patterns like the symmetrical triangle pattern or head and shoulders to complete. This shorter timeframe is part of what makes flags useful to short-to-medium-term traders, but it also means there’s less time available to confirm the pattern before a decision point arrives. Volume during the flag stage is typically markedly lower than during the flagpole — a genuine contraction in participation is one of the more reliable tells that the move is a pause rather than a reversal already underway.
3. The breakout. The pattern resolves when price breaks out of the flag channel in the same direction as the original flagpole — upward for a bull flag, downward for a bear flag. A breakout accompanied by an expansion in volume is read as a stronger signal than one that occurs on thin, unconvincing participation, since renewed volume suggests the original trend’s underlying force is reasserting itself rather than the breakout being a low-conviction drift.
It’s also worth understanding what happens on the timeframes traders actually use to spot these patterns. Flags are commonly identified on intraday and daily charts alike — a flagpole that plays out over a handful of hours on a 15-minute or hourly chart follows the same structural logic as one that plays out over several daily candles, just compressed. What matters is the relationship between the two legs (a fast, decisive flagpole versus a slow, contained flag), not the specific timeframe in isolation. A trader working an hourly chart and a trader working a daily chart can both be looking at a valid bull flag or bear flag on their respective timeframes; the pattern is scale-independent even though its typical duration (days, not weeks) holds across most of the timeframes where it’s commonly traded.
A retest of the broken boundary is another detail worth watching for. After a genuine breakout, price sometimes pulls back to retest the broken trendline — the former flag boundary — before continuing in the breakout direction. This retest, when it holds, is often treated as a lower-risk secondary entry point than chasing the initial breakout candle, since it offers a tighter, more defined stop-loss reference. Not every breakout retests, and waiting for one that never comes means missing the move entirely — which is part of why entry technique is ultimately a matter of trade-off, not a single “correct” method.
How to Trade Bull Flag and Bear Flag Patterns
The trade logic is identical in structure for both patterns — only the direction flips.
Entry. The standard entry point is a confirmed breakout beyond the flag’s channel boundary in the direction of the original flagpole: above the upper trendline for a bull flag, below the lower trendline for a bear flag. Some traders wait for a candle close beyond the boundary rather than acting on an intraday touch, since a boundary can be pierced briefly without a genuine breakout following through.
Confirmation. Volume expansion on the breakout candle (or the period immediately following it) is the most commonly cited confirmation signal for both patterns. A breakout on visibly lower volume than the original flagpole is treated with more caution, since it raises the odds of a false break that reverses shortly after.
Stop-loss placement. A stop is typically placed just beyond the opposite boundary of the flag channel — below the lower trendline for a bull flag trade, above the upper trendline for a bear flag trade. This placement is designed so that if price re-enters the flag channel and moves through it entirely, the original continuation thesis is treated as invalidated rather than held onto in hope.
Target-setting via the measured move. The standard target method for both patterns is the “measured move”: take the height of the flagpole (from its starting point to its high, for a bull flag; to its low, for a bear flag) and project that same distance from the breakout point in the direction of the trade. This is the conventional technical-analysis method taught for flag patterns generally — it is a projection technique, not a guarantee of where price will actually travel, and it should be paired with ordinary risk management (position sizing, a defined stop, and awareness of nearby support/resistance levels that could interrupt the projected move) rather than treated as a fixed promise.
Position sizing. Because flags form and resolve relatively quickly, the distance between a sensible entry and a sensible stop-loss is often smaller than with slower, wider chart patterns — which can make position sizing feel deceptively easy to scale up. That smaller stop distance doesn’t reduce the underlying risk of being wrong; it simply changes the arithmetic. A consistent approach — risking a fixed, modest percentage of account capital on any single trade, regardless of how confident the setup looks — matters at least as much here as with any other pattern.
As with every pattern covered on this site, none of this constitutes financial advice, and no setup — however textbook it looks — removes the need for a defined stop-loss and sensible position sizing.
What Is the Difference Between a Flag Pattern and a Pennant Pattern?
The core distinction is the shape of the consolidation, not the flagpole or the measured-move logic, which apply the same way to both. A flag consolidates inside a parallel channel — the upper and lower boundary lines run at roughly the same angle, keeping the channel a consistent width from start to finish. A pennant, by contrast, consolidates inside a converging, narrowing shape — essentially a small symmetrical triangle sitting on top of the flagpole, with the boundary lines angling toward each other rather than running in parallel. The symmetrical triangle pattern is the closest full-sized analogue to a pennant’s converging shape, just typically taking longer to form and not necessarily following a sharp flagpole move the way a pennant does. Both flags and pennants use the same flagpole-height measured-move target once the breakout occurs — the naming difference comes down entirely to whether the pause is parallel (flag) or converging (pennant).
In practice, telling the two apart on a live chart comes down to how the swing highs and lows of the consolidation line up. Plot the minor highs of the pullback and the minor lows separately: if both lines run at a similar downward or upward slope and stay roughly the same distance apart throughout, that’s a flag. If the highs and lows are converging toward a single point — the range narrowing candle by candle — that’s a pennant. Traders sometimes also distinguish the two by duration and tightness: pennants tend to compress into a noticeably smaller price range than flags before resolving, since the converging structure by definition squeezes the range down as it approaches its apex. Neither distinction changes how the trade is managed once a breakout is confirmed — entry, stop, and measured-move target all follow the same logic either way.
What Is the Difference Between a Bull Flag and a Rising Wedge?
This comparison trips up more traders than the pennant distinction, because both patterns involve a corrective move that runs against the immediately preceding price action, and both can appear after an uptrend. The difference is in the shape of the trendlines and what the pattern implies about what comes next. A rising wedge pattern has trendlines that converge — narrowing as price grinds higher within the wedge — and when it appears after an extended uptrend, it is typically read as carrying reversal risk rather than continuation potential; rising wedges also tend to take noticeably longer to form than a flag. A bull flag’s boundary lines, by contrast, stay roughly parallel rather than converging, it forms over a much shorter timeframe, and it is read as a continuation pattern rather than a reversal warning. In short: converging and slow leans wedge/reversal; parallel and quick leans flag/continuation — but neither shape guarantees the outcome it’s typically associated with, which is exactly why volume and breakout confirmation matter for both.
Volume behavior offers a second useful clue where the trendline shapes alone are ambiguous. A rising wedge that precedes a reversal often shows deteriorating volume across the entire formation, consistent with a fading trend running out of genuine buying interest before it turns over. A bull flag, by contrast, typically shows a sharp volume spike on the flagpole followed by a clear volume contraction during the flag itself — a healthier, more decisive pattern than a wedge’s gradual fade. Because both patterns can look superficially similar on a quick glance at price alone, checking the trendline convergence first and the volume profile second is a reasonable order of operations for telling them apart before placing a trade.
Risks and Limitations of Trading Bull and Bear Flags
Flags are a widely taught pattern, but they carry real, specific risks that are worth stating plainly rather than glossing over.
False breakouts. Because flags are tight, short-duration consolidations, a breakout beyond either boundary can reverse quickly, especially when the breakout occurs on low volume. A false break can trap traders who entered on the initial move before price snaps back through the channel.
Misidentifying a flag versus the start of a genuine reversal. Not every countertrend pause after a sharp move is a flag. If the “flag” consolidation runs unusually long, breaks its own parallel structure, or fails repeatedly to resolve in the flagpole’s direction, it may be signaling an actual trend change rather than a brief pause — treating it as a guaranteed continuation setup in that scenario is a common and costly mistake.
Less time to confirm. Because flags typically form over days rather than weeks, there is less time available to gather confirming evidence before a breakout decision point arrives, compared to slower-forming patterns. This compressed timeframe raises the practical difficulty of waiting for genuine confirmation without also chasing a move that has already run.
Volume confirmation is not optional. A breakout that lacks a corresponding increase in volume is meaningfully less reliable than one that’s accompanied by it. Traders who skip checking volume and act on price movement alone take on materially more false-signal risk.
Context matters as much as the pattern itself. A bull flag that forms after a rally into a well-established resistance zone, or a bear flag that forms into strong support, carries different odds than the same-looking pattern forming in open space with no nearby structure. Reading a flag in isolation from the surrounding chart — support/resistance levels, higher-timeframe trend direction, and any scheduled market-moving events — omits information that materially affects how the pattern is likely to resolve.
Overfitting the pattern to fit a bias. Because flags are so widely taught, it’s easy to see one wherever a small pullback occurs, particularly when a trader already has a directional opinion and is looking for a chart pattern to justify it. Insisting on the full checklist — a genuine high-volume flagpole, a tight and roughly parallel channel, contracting volume during the pause, and a confirmed breakout with renewed volume — before acting is what separates disciplined pattern trading from confirmation bias dressed up as technical analysis.
None of these risks are unique to flags — they apply to continuation patterns broadly — but the short duration of the flag pattern specifically compresses the decision window, which is the detail most worth remembering. As always, no chart pattern removes the need for a stop-loss, sound position sizing, and an awareness that price can and does behave unpredictably regardless of how clean a setup looks on the chart. Trading decisions should be made in the context of a broader trading plan and appropriate risk management, not on the strength of a single chart pattern alone.
FAQs
Is a bull flag bullish or bearish?
A bull flag is a bullish continuation pattern — it forms during an uptrend and typically resolves with price continuing higher after the flag’s consolidation completes and a confirmed breakout occurs.
How long does a flag pattern typically take to form?
Flags typically form over a matter of days rather than weeks, making them notably shorter in duration than most other chart patterns, such as triangles or head-and-shoulders formations, covered on this site.
What is the measured-move target for a flag pattern?
The standard target is the flagpole’s height projected from the breakout point in the trend’s direction. It is a projection technique used alongside a defined stop-loss, not a guaranteed price outcome.
What is the difference between a bull flag and an ascending triangle?
An ascending triangle pattern has a flat resistance line with rising support and typically takes longer to form; a bull flag has parallel, downward-sloping boundaries and forms much faster after a sharp rally.
Key Takeaways
- A bull flag is a bullish continuation pattern: a sharp rally (flagpole) followed by a tight, downward-sloping pause (flag) that resolves higher on breakout.
- A bear flag is its bearish mirror image: a sharp decline followed by a tight, upward-sloping pause that resolves lower on breakout.
- Both patterns are identified by a parallel (not converging) consolidation channel — the detail that separates a flag from a pennant.
- The standard target method is the measured move: project the flagpole’s height from the breakout point.
- Flags form faster than most other chart patterns, which means less time to confirm and a real need for volume confirmation and disciplined stop-loss placement.
Summary
Bull flags and bear flags are short-term continuation patterns built on the same flagpole-and-channel logic, just running in opposite directions: a bull flag pauses within an uptrend before continuing higher, while a bear flag pauses within a downtrend before continuing lower. Both are identified by a tight, roughly parallel consolidation channel following a sharp impulsive move, and both are traded the same way — breakout entry, volume confirmation, a stop beyond the opposite channel boundary, and a measured-move target projected from the flagpole’s height. Because flags form quickly and can fail or reverse without warning, volume confirmation and defined risk management matter more here than the pattern’s popularity might suggest. For a broader foundation before working through more chart patterns like this one, see forex trading basics, or continue with the symmetrical triangle pattern or the rectangle chart pattern as related continuation-pattern comparisons.
—
*This article is for educational purposes only and does not constitute financial advice. Trading forex carries a high level of risk and may not be suitable for all investors. Past pattern behavior does not guarantee future results.*