Cup and Handle Pattern: What It Is and How to Trade It
The cup and handle pattern is a bullish continuation setup that shows up on a price chart as a rounded, U-shaped recovery (the “cup”) followed by a smaller, shallower pullback (the “handle”) just before price breaks higher. Traders use it to spot a pause-and-resume structure inside an existing uptrend, entering on a breakout above the handle’s resistance once volume confirms the move. It originated in equities technical analysis and is well documented in stock trading, so before applying it to forex, it’s worth understanding where it does — and doesn’t — translate cleanly to currency pairs.
This guide breaks down what a cup and handle pattern looks like, how it forms step by step, whether it’s actually reliable on forex charts, the bearish inverse version, and a practical framework for entries, stops, and targets. If you’re still getting comfortable with the basics of reading price charts, our forex trading basics guide is a good starting point before diving into pattern-specific setups like this one.
What Is a Cup and Handle Pattern?
A cup and handle pattern is a bullish continuation formation made up of two distinct parts. The first part — the “cup” — is a rounded, U-shaped dip and recovery in price, where the market declines gradually, bottoms out, and then climbs back toward its prior high. The second part — the “handle” — is a smaller, shorter consolidation or pullback that forms on the right side of the cup, just below the previous high, before price breaks out to new highs.
Visually, the pattern resembles a teacup viewed from the side: a wide, rounded bowl (the cup) with a short downward-drifting handle attached near the rim. The rounding is the key visual signature — a sharp V-shaped drop and recovery does not count as a valid cup, because the gradual curve is what signals a genuine shift from selling pressure to accumulation rather than a single panic-and-snap-back move.
What the pattern signals is straightforward: after an initial decline, buyers gradually regain control, price recovers to test the old high, a brief bout of profit-taking or hesitation forms the handle, and then fresh buying pressure pushes price through resistance. It’s read as a continuation pattern because it typically appears within a broader uptrend, suggesting the prior trend is likely to resume once the breakout is confirmed.
How Does a Cup and Handle Pattern Form?
The cup and handle pattern builds in a fairly predictable sequence. Understanding each stage helps you avoid misreading a random rounded dip as a tradable setup.
1. The Initial Decline (Left Side of the Cup)
Price is in an established uptrend, then pulls back from a recent high. This decline forms the left wall of the cup. It shouldn’t be a sudden crash — a gradual, controlled pullback is more consistent with the pattern than a sharp sell-off driven by a single news event or panic-selling spike. The decline can be triggered by ordinary profit-taking after a run-up, a broader pullback across the wider market, or simply a natural pause after an extended move. What matters for pattern validity is the character of the decline: measured and rounded rather than vertical and abrupt.
2. The Rounded Bottom
Instead of reversing sharply (a V-shape), price bottoms out gradually, often trading sideways-to-slightly-lower for a period before curling back upward. This rounding reflects a slow transition from selling pressure to accumulation — sellers lose momentum, buyers begin stepping back in incrementally rather than all at once. A sharp, narrow V-bottom is generally not considered a valid cup formation, because a V-shaped reversal reflects a sudden shift in sentiment rather than the gradual base-building process the cup and handle pattern is meant to capture. The wider and more rounded the bottom, the more the pattern reflects genuine accumulation rather than a brief dip that happened to bounce.
3. The Recovery (Right Side of the Cup)
Price climbs back up from the rounded bottom, retracing toward the level of the prior high that marked the start of the decline. This recovery forms the right wall of the cup, completing the U-shape. Ideally, the right side of the cup mirrors the left side in duration and character — a steady, controlled climb rather than an erratic, spike-driven rally — though perfect symmetry isn’t a strict requirement for the pattern to be considered valid.
4. The Handle
As price approaches the prior high, it typically stalls and drifts modestly lower or sideways — this is the handle. It’s a shorter, shallower pullback than the decline that formed the cup itself, generally retracing only a portion of the cup’s right-side recovery rather than giving back the bulk of the gains. The handle reflects short-term profit-taking or hesitation among buyers right at a resistance zone, rather than a fresh bearish shift. A handle that retraces too deeply, or that takes as long to form as the cup itself, starts to look less like a healthy pause and more like a genuine trend change — which is one reason traders watch the handle’s depth and duration closely rather than assuming any small pullback near the highs automatically qualifies.
5. The Breakout
Once the handle completes, a breakout above the handle’s resistance (which is also close to the cup’s original high) signals the pattern is complete and the prior uptrend is resuming. This is the point where the setup transitions from a pattern being tracked on the chart to an actionable trade signal, assuming the breakout is accompanied by the kind of confirmation discussed in the sections below.
Volume Behavior Through the Pattern
Volume is commonly cited as a supporting factor for this setup, following a broad pattern: relatively higher volume during the initial decline and the recovery phase of the cup, contracting volume through the handle as trading interest quiets down, and an ideal increase in volume on the breakout itself, which helps confirm that the move is backed by genuine participation rather than a low-conviction drift through resistance.
Is the Cup and Handle Pattern Reliable in Forex?
This is worth addressing directly rather than glossing over, because the cup and handle pattern’s roots are in equities technical analysis — it was popularized through stock chart research and remains far more commonly referenced in stock trading circles than in forex-specific material.
The underlying continuation logic — a rounded recovery followed by a shallow pullback and a resumption of the prior trend — is not exclusive to stocks, and the same principle can apply to currency pairs in theory. But there’s a genuine practical caveat that matters for forex traders: a valid cup and handle pattern typically needs a longer formation window to develop properly, often stretching across several weeks to a few months on the underlying chart. That timeframe requirement is a structural feature of the pattern itself, not a forex-specific quirk, but it interacts differently with how forex is usually traded.
Because a large share of retail forex activity happens on shorter intraday and swing-trading timeframes, a pattern that needs weeks or months to form properly is going to show up far less often — and be far less reliably identifiable — on those shorter charts. Attempting to force a cup and handle read onto a 1-hour or 4-hour forex chart increases the risk of misidentifying an ordinary rounded pullback as a genuine cup formation, when it may simply be short-term noise.
The practical takeaway: the cup and handle pattern is more relevant on daily and weekly forex charts, where there’s enough time and price history for a genuine multi-week rounding structure to develop, than it is on shorter intraday timeframes. It is not equally common or equally reliable across all forex timeframes, and this guide isn’t presenting it as a universal, context-free setup — treat it as a longer-horizon pattern that fits position-trading and swing-trading approaches on higher timeframes better than fast-moving short-term forex strategies.
There’s a second, related consideration for forex traders specifically: volume data. Equities technical analysis leans heavily on exchange-reported volume to confirm patterns like the cup and handle, since stock volume reflects actual shares traded on a centralized exchange. Forex is a decentralized, over-the-counter market, so the “volume” most retail platforms display is typically tick volume — a count of price changes — rather than a true measure of traded size across the entire global market. That doesn’t make volume analysis useless in forex, but it does mean the volume-based confirmation signals described in this guide should be treated as directional supporting evidence rather than as precise, exchange-verified data the way they might be read on a stock chart.
Put together, these two factors — the pattern’s naturally longer formation window and the limitations of forex volume data — are exactly why this guide treats the cup and handle as a pattern best suited to patient, higher-timeframe forex analysis rather than a go-to setup for fast intraday trading.
What Is the Inverse Cup and Handle Pattern?
The inverse cup and handle is the bearish mirror image of the standard pattern. Instead of a rounded bottom followed by a small downward-drifting handle, the inverse version features a rounded top — shaped like an upside-down “n” — followed by a smaller, shorter upward-drifting handle, before price breaks down to the downside.
The formation sequence mirrors the standard pattern in reverse: price rallies to a high, then rounds over gradually into a domed top rather than snapping down sharply, then declines back down toward the level of the initial rally’s starting point, completing the inverted cup. From there, a brief upward drift or consolidation forms the handle — a short-lived bounce that stalls below the prior swing high — before sellers regain control and price breaks down through the handle’s support.
Like its bullish counterpart, the inverse cup and handle is read as a continuation pattern, typically appearing within an existing downtrend and signaling that the prior bearish move is likely to resume once the breakdown is confirmed. The same volume logic generally applies in reverse: relatively higher volume through the initial decline and the rounding-over phase, contracting volume through the handle as the bounce loses steam, and an ideal increase in volume on the breakdown to help confirm genuine selling pressure rather than a drift through support on thin participation.
The same forex-timeframe caveat from the section above applies equally here — the inverse cup and handle also needs a longer formation window to develop validly, so it’s more relevant on higher forex timeframes than on fast-moving intraday charts.
One distinction worth keeping in mind: because the inverse cup and handle is less frequently discussed than the standard bullish version, there’s a slightly higher risk of traders misapplying it — assuming any rounded top followed by a small bounce automatically qualifies. The same discipline that applies to the standard pattern applies here: the rounding needs to be genuine and gradual, not a sharp spike-and-reverse, and the handle needs to be a shallow, controlled bounce rather than a strong counter-trend rally that could just as easily be the start of a fresh uptrend.
How to Trade a Cup and Handle Pattern
Trading a cup and handle pattern generally follows the same breakout-based approach used across most continuation patterns, built around a defined entry, confirmation, stop-loss, and target.
Entry
The typical entry point is a breakout above the handle’s resistance level, which usually sits close to the cup’s prior high. Some traders wait for a confirmed close above this level rather than entering on the first intraday touch, to reduce the risk of reacting to a brief spike that doesn’t hold. Others wait for a retest of the breakout level — where price breaks out, pulls back to test the old resistance as new support, and then resumes higher — as a way of confirming the level is holding before committing to the trade. Neither approach is inherently correct; each is a trade-off between entering earlier with less confirmation or entering later with more confirmation but a less favorable entry price.
Confirmation
Volume expansion on the breakout is commonly used as a confirming signal — a breakout on noticeably higher volume than the quiet handle phase is considered more credible than one that drifts through resistance on light participation. As noted above, forex traders should treat tick-volume readings as directional rather than exact, and may want to combine volume with other confirmation tools, such as candlestick close strength or multi-timeframe trend alignment, particularly on currency pairs where reported volume is less reliable than on exchange-traded instruments.
Stop-Loss Placement
A common approach is placing the stop-loss below the low of the handle. Since the handle represents the most recent, tightest consolidation before the breakout, a move back below it suggests the breakout has failed and the setup is invalidated. Some traders prefer a slightly wider stop below the midpoint of the cup itself, especially on more volatile forex pairs, to avoid being stopped out by routine short-term noise around the handle low. The right choice depends on account risk tolerance and position sizing, not a single fixed rule.
Target-Setting
Targets are commonly projected using a measured-move calculation: the depth of the cup (the vertical distance from the cup’s high down to its lowest point) is measured, then projected upward from the breakout point to estimate a potential target. This is a technical projection method, not a promise — actual price behavior after a breakout depends on broader market conditions, and no pattern-based target should be treated as a guaranteed outcome. Some traders scale out of a position in stages as price approaches the projected target, rather than exiting the entire position at once, as a way of managing the uncertainty inherent in any projection-based target.
As with any chart pattern, none of this framework guarantees a particular result. Trade the cup and handle pattern as one structured input within a broader risk-managed approach, not as a standalone signal for how price must behave.
What Is the Difference Between a Cup and Handle and a Rectangle Pattern?
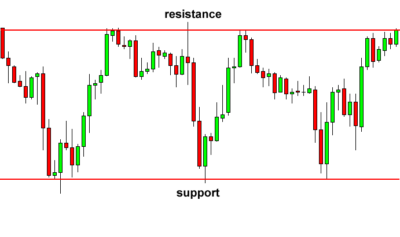
The core distinction is shape and structure. A rectangle pattern is a sideways consolidation bound by two roughly parallel horizontal levels — price bounces between a flat support level and a flat resistance level with no rounding involved. A cup and handle, by contrast, has a distinctly rounded, U-shaped recovery structure (the cup) followed by a smaller secondary pullback (the handle) — a two-stage formation rather than a single sideways range. The rounding of the cup and the two-part cup-then-handle sequence are what separate this pattern from a simple horizontal rectangle.
What Is the Difference Between a Cup and Handle and an Ascending Triangle?
Both the cup and handle and the ascending triangle pattern are bullish continuation patterns that can appear after a comparable price recovery, which makes them worth distinguishing clearly. The key difference is shape and duration: a cup and handle has a rounded, gradually curving recovery that typically takes weeks to months to complete, while an ascending triangle is built from straight-line, rising higher lows compressing against a flat horizontal resistance ceiling — a geometric, angular structure rather than a curved one. The ascending triangle also typically forms over a notably shorter window than the cup and handle’s longer, more gradual rounding process.
Risks and Limitations of Trading the Cup and Handle Pattern
Like every chart pattern, the cup and handle comes with real limitations that deserve attention before trading it.
False breakouts. Price can break above the handle’s resistance and then reverse back below it, trapping traders who entered on the initial move. Waiting for a confirmed close and genuine volume expansion helps reduce, but does not eliminate, this risk.
Misidentifying the cup. Because the defining feature of a valid cup is its rounded shape, there’s real risk of mistaking an ordinary rounded pullback within a longer trend for a genuine cup and handle setup, especially on lower timeframes where price naturally curves in and out of minor consolidations without any continuation implication.
The longer formation window. As covered above, the cup and handle typically needs weeks to months to develop validly, which makes it considerably harder to trade with confidence on shorter, fast-moving forex timeframes than on daily or weekly charts.
Need for volume confirmation. Where volume data is unreliable or unavailable — which can be a genuine constraint in decentralized forex markets compared to centralized equity exchanges — confirming the breakout becomes harder, and traders may need to lean more heavily on price action and multi-timeframe context instead.
One input among several. A cup and handle pattern, like any single technical setup, should not be treated as a standalone trading signal. It’s most useful as one part of a broader analysis that includes trend context, support/resistance levels, and a defined risk-management plan.
FAQs
How long does a cup and handle pattern take to form?
It varies, but the pattern typically needs a longer window than most chart patterns — commonly several weeks to a few months — which is why it’s more reliably identified on daily and weekly charts.
What is the ideal depth of the cup in a cup and handle pattern?
There’s no fixed rule, but the cup is generally expected to be a moderate, gradual pullback rather than an extremely deep or extremely shallow move — the rounding shape matters more than any specific depth threshold.
Can the cup and handle pattern fail?
Yes. Price can break out and then reverse (a false breakout), or the handle can break down instead of up, invalidating the bullish setup entirely — no chart pattern guarantees a specific outcome.
What is the difference between a cup and handle and a rounding bottom pattern?
A rounding bottom is essentially the cup portion on its own, without a handle — it signals a gradual reversal or continuation once price clears the prior high. The cup and handle adds the second-stage handle pullback before the breakout, giving it an extra confirmation step the plain rounding bottom doesn’t have.
Summary
The cup and handle pattern is a bullish continuation setup built from a rounded, U-shaped recovery followed by a smaller downward-drifting handle, with a breakout above the handle’s resistance signaling the prior trend is likely to resume. Its bearish mirror image, the inverse cup and handle, follows the same logic in reverse — a rounded top and a small upward-drifting handle ahead of a breakdown. Both versions typically need a longer formation window than is common on fast-moving forex timeframes, so they tend to show up more reliably on daily and weekly forex charts than on short-term intraday setups.
If you’re building out your understanding of chart patterns from the ground up, revisit our forex trading basics guide, or continue exploring related continuation structures like the rectangle chart pattern, the bull flag pattern, and the falling wedge pattern to compare how different consolidation shapes signal different things.